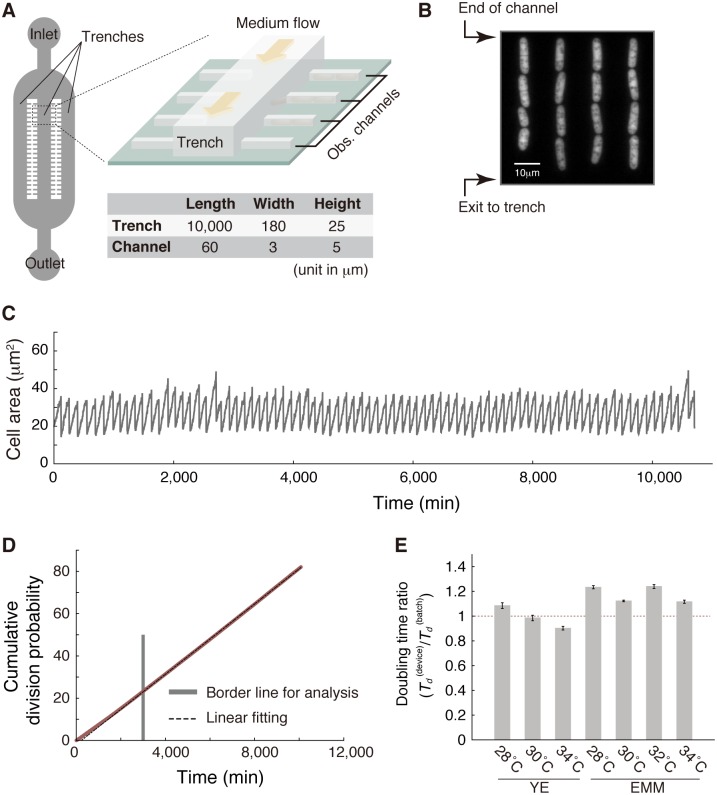
Fig 1. Stability of cell division rate in the microfluidic device.
(A) Schematic representation of the device (not to scale, for clarity). Approximate dimensions of the trenches and observation channels are presented in the table. (B) An example of a fluorescence image of yeast cells expressing mVenus loaded into the observation channels. (C) Trajectory of cell size of a single representative lineage in yeast extract medium (YE) at 30°C. (D) The cumulative division probability in YE at 34°C, plotted against time (red). Linear fitting (black broken line) was performed using the time window (t ≥ 3,000 min in this example, indicated by a gray vertical line) in which stable growth was achieved. See also S3 Fig. (E) Estimated population doubling times in the microfluidic device (Td (device)) relative to those in batch cultures (Td (batch)). EMM, Edinburgh minimal medium. See Materials and methods for estimation of the population doubling times from the generation time distributions. The numerical values for the plots are deposited in the Dryad repository: http://dx.doi.org/10.5061/dryad.s2t5t/15.

