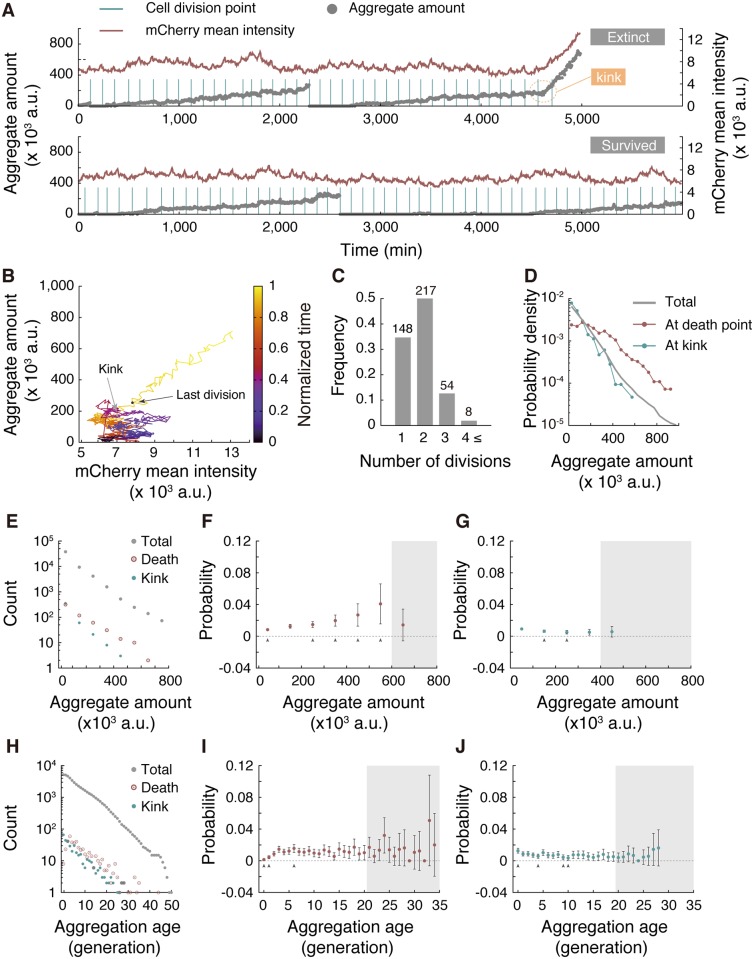
Fig 6. Relationship between Hsp104-associated protein aggregate and death.
(A) Typical dynamics of Hsp104-associated protein aggregate (gray closed circles) and constitutively expressed mCherry level (red line) of an extinct lineage (top) and a survived lineage (bottom). The dying process begins around 4,500 min (indicated by a dotted orange circle) in this example, after which both aggregate amount and mCherry signals increase. (B) Dynamics of protein aggregation and mCherry levels plotted in a 2D plane. The data are from the same (extinct) cell lineage shown in (A). Time evolution is indicated by colors from dark blue to yellow. The black and gray points indicate the states at the last division and the kink position, respectively. (C) The number of cell divisions after the kinks until cell death. The figures on top of the bars represent the number of lineages identified. (D) Distributions of aggregate amount at death points (red), kinks (blue), and for all regions of interest (ROIs; gray). (E) Distributions of aggregate amount at birth for all identified cell cycles (gray), for the last generations in extinct lineages (red), and for generations in which the accelerated accumulation (initiation of death) started (blue). (F) Probability of death of cells born with different amounts of aggregate. Gray arrowheads indicate data points whose deviations from the population death probability (p = 1.15 × 10⁻²) are statistically significant (binomial test at the significance level α = 0.05. See Materials and methods for details). Data points within the gray-shaded area do not satisfy the commonly employed rule of Np ≥ 5 for appropriate normal approximation (N, the number of samples) and are excluded from the tests. Error bars show standard errors. The same rule applies to the arrowheads, the gray-shaded area, and the error bars in panels (G), (I), and (J) below. (G) Probability of initiating cell death (= observing a kink) for cells born with different amounts of aggregate. (H) Distributions of aggregation age for all of the ROIs (gray), at death points (red), and at kinks (blue). (I) Death probability at each aggregation age. (J) Probability of observing a kink at each aggregation age. The numerical values for the plots are deposited in the Dryad repository: http://dx.doi.org/10.5061/dryad.s2t5t/15.

