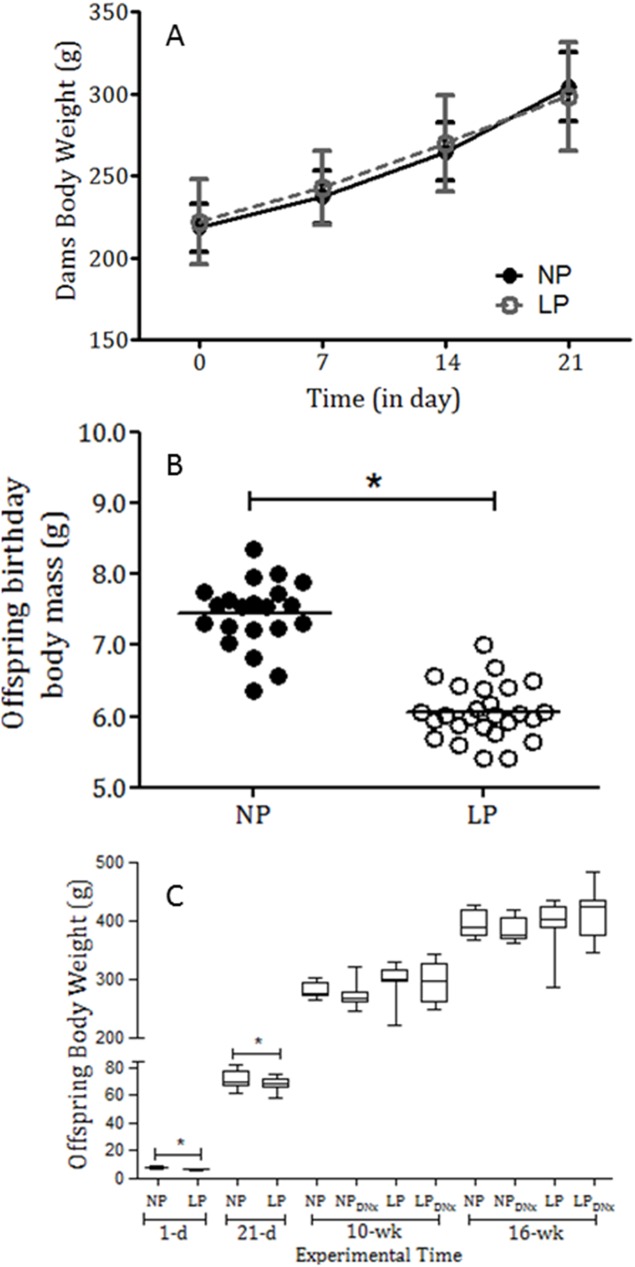
Fig 1.
Dams’ body weights (A), offspring body weight at birth (B) and (C) 1-day, 21-day, 10-week, and 16-week-old NP and LP body weight (in grams) compared with bilateral renal denervated NP and LP offspring. The results are expressed as means ± SD, means ± scatter dot plot, and median and quartile deviation. Data were analyzed using nonparametric analysis by Kruskal–Wallis or Student´s t-test and two-way ANOVA test with post hoc comparisons by Bonferroni’s contrast test. The level of significance was set at *P < 0.05.

