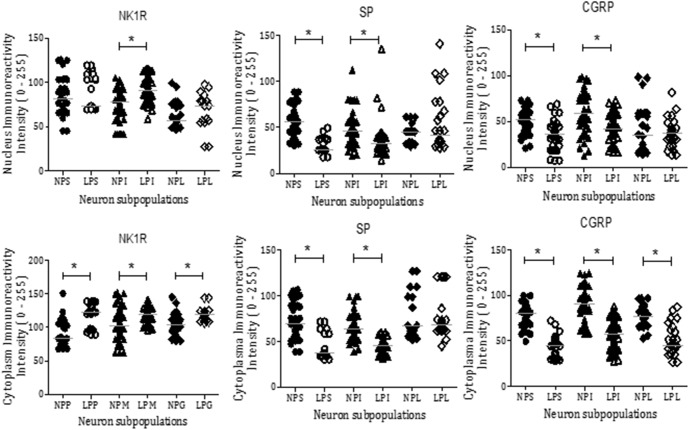
Fig 5. Comparative statistical analysis of NK1R, SP, and CGRP expression in the nucleus and cytoplasm.
The graphical representation depicts immunoreactivity in the cytosol and nucleus from small (S), intermediate (I) and large (L) neurons of T13 DRG from LP and NP rats. The data are reported as the means ± scatter dot plot; n = 15 animals for each group; *P ≤ 0.05 vs. NP offspring (Student’s t-test).

