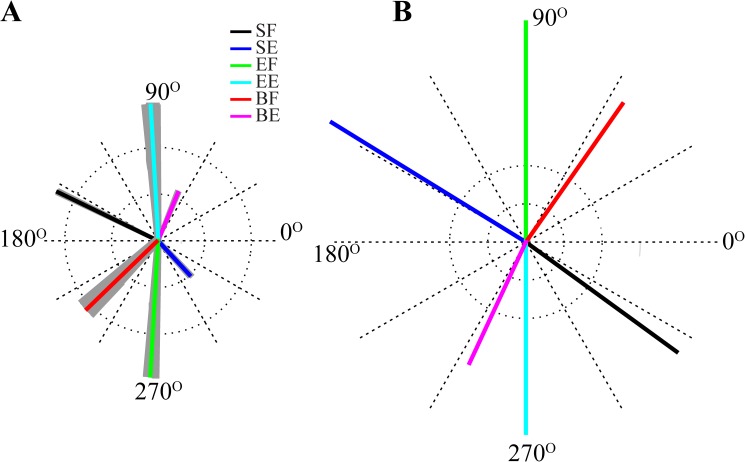
Fig 6. Distribution of preferred directions.
Preferred directions (PDs) of cortical neurons (A) and Ia afferents (B) are fairly uniformly distributed over 360º. Colored lines show averaged PDs of cortical neurons and Ia afferents (FBIa) for corresponding muscles. The gray areas around each line represent standard deviation across 50 simulations with randomly chosen torque distribution parameter values. The length of each vector reflects the index of directional modulation. PDs of antagonist flexor and extensor related neurons and feedback are 180º apart. PDs of cortical activity are similar to the PDs of the antagonist Ia feedback. Please note that the afferents are independent of the torque distribution and have the same PD for all 50 simulations.

