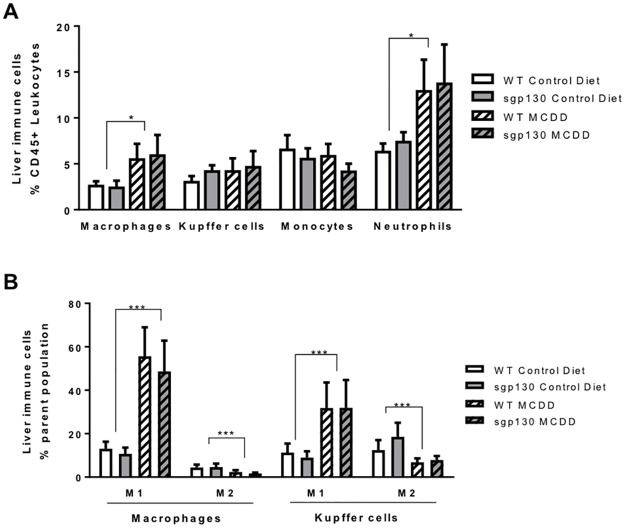
Fig 4. Sgp130Fc transgenic mice exhibit a similar inflammatory phenotype in response to a MCD diet.
Flow cytometry on livers from 4 weeks fed control and methionine and choline deficient diet (MCDD) mice was performed and showed (A) liver immune cells liver as percent of leukocytes (CD45+ cells) and (B) macrophages and Kuppfer cells inflammatory phenotype as percent of total macrophages and Kuppfer cells respectively. Data expressed as average ± SEM, n = 6–7. Statistical analysis by 2 way ANOVA, * p<0.05; ***p<0.001 Main effect for Control vs MCDD.

