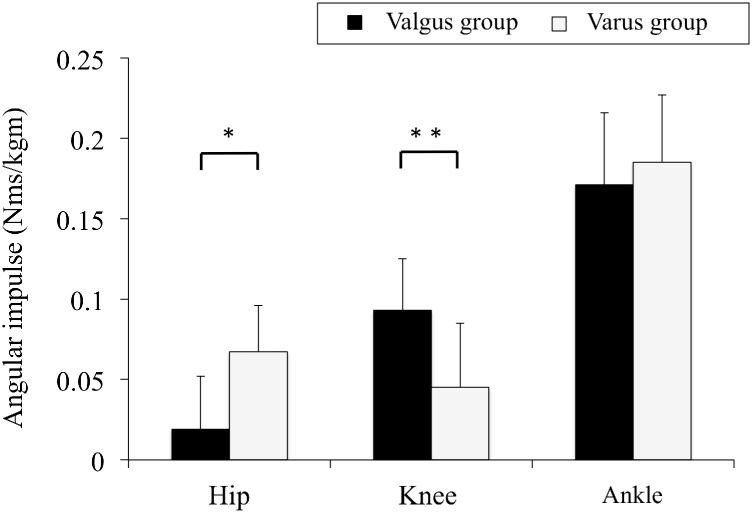
Fig 3. Angular impulses in the lower extremity joints of the knee valgus and varus groups.
This figure represents the means of the hip, knee, and ankle angular impulses and standard deviations of the knee valgus and varus groups during the deceleration phase of a single-leg drop vertical jump. These variables were normalized to the product of the subject’s body weight (kg) and height (m). Asterisks indicate significant differences between the valgus and varus groups (*; p<0.01, **; p<0.05).

