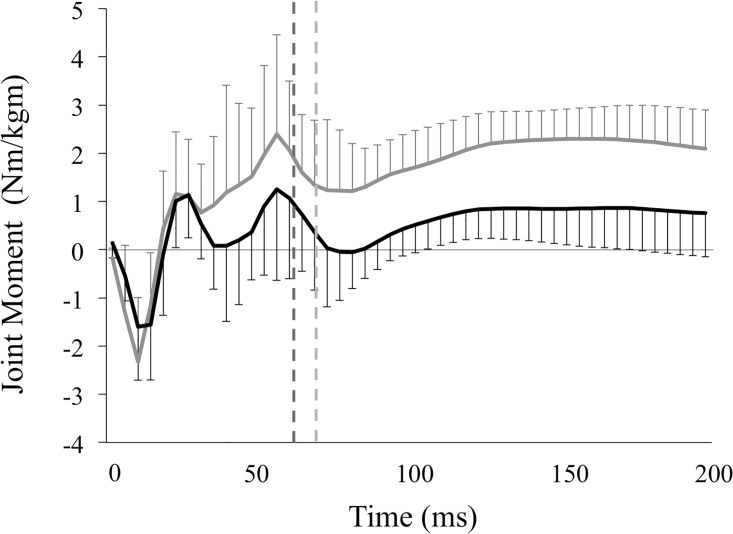
Fig 4. Moments in the hip joint of the knee valgus and varus groups.
This figure represents the means of the hip extensor moment and standard deviations of the knee valgus (solid black lines) and knee varus groups (solid gray lines) during the landing phase. These variables were normalized to the product of the subject’s body weight (kg) and height (m). The vertical broken lines represent the end of the deceleration phase, which is defined as the period from the initial ground contact to the peak of vGRF in the valgus (black lines, 61.2 ± 9.32 ms) and varus groups (gray lines, 69.4 ± 19.4 ms). Variables were calculated by integrating the hip extensor moment—time curves during the deceleration phase, representing the hip extensor angular impulse.

