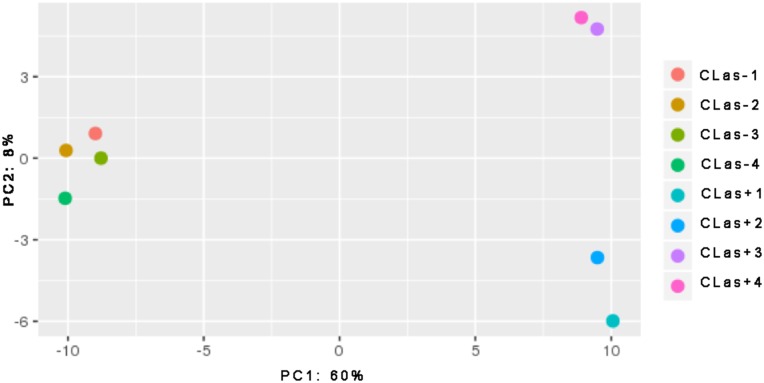
Fig 1. Principle components analysis (PCA) showing variations among replicates of RNA sequencing data.
Four different replicates for each sample, either CLas exposed (CLas+) or non-exposed (CLas-, psyllids reared on healthy citrus plants) are plotted on the PCA plot. Approximately 60% of the variation is seen in principle component (PC) 1, which can be explained by differences in the CLas status of the samples (either + or -). Variation in PC2 is much less, 8% and can be ascribed to expression variation among CLas+ samples.

