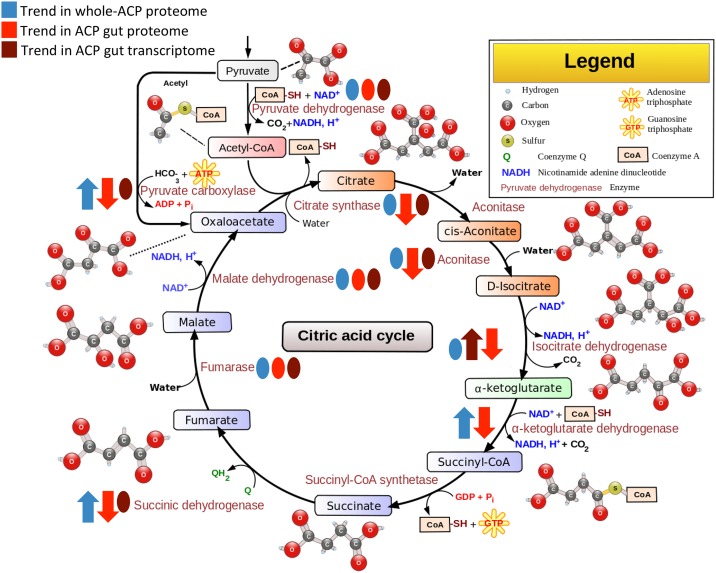
Fig 3. Schematic diagram of the citric acid cycle showing the trend of regulation in the proteome upon CLas exposure.
This image was taken from https://en.wikipedia.org/wiki/File:Citric_acid_cycle_with_aconitate_2.svg and adapted to indicate up- and down-regulation shown by proteomic and transcriptomic data using the creative commons license http://creativecommons.org/licenses/by-sa/3.0/deed.en. Blue shapes reflect the whole body ACP proteome data from [14], red shapes reflect the ACP gut proteome, and maroon shapes reflect the gut transcriptome. Arrows indicate the trend of up- or down-regulation, and ovals indicate that these enzymes were detected but were not differentially expressed.

