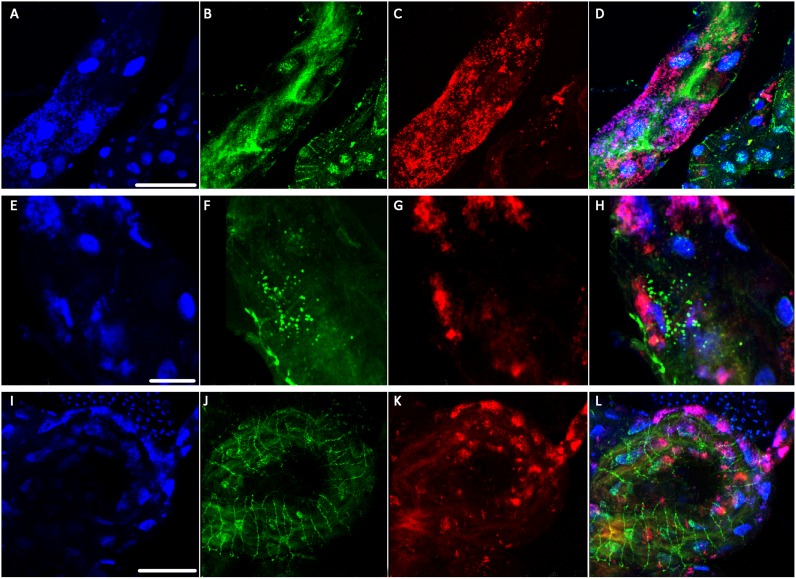
Fig 5. High magnification images of CLas and Wolbachia in CLas exposed guts visualized using fluorescence in situ hybridization (FISH) and confocal microscopy.
CLas signal (Cy3) is in green, Wolbachia (Cy5) in red, and DAPI counterstaining of nuclei is in blue. (A-D) Optical cross-section of the gut visualizing CLas localization in along the brush border membrane of the gut lumen. Rarely, CLas can be seen co-localized with the DAPI signal, indicating nuclear association. Wolbachia signal does not overlap with CLas signal, see overlay (D), although the two bacteria are frequently observed within the same cell. (E-H) CLas can also be observed in puncta within cells and there is no overlap with Wolbachia in this distribution either. (I-L) At the basal surface of the gut, CLas is frequently observed along the actin cytoskeleton of the gut-associated muscles. Wolbachia signal is never detected in these filaments. Scale bars = A-D 25μm, E-H 25μm and I-L 75μm.

