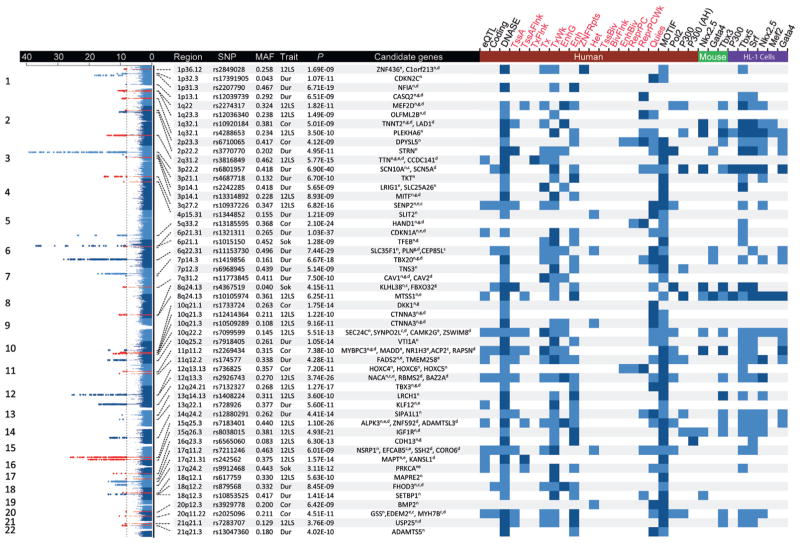
FIGURE 1. Genome-Wide Associations and Candidate Genes.
This overlay Manhattan plot shows the results for the genome-wide associations with QRS traits among Europeans. Single nucleotide polymorphisms (SNPs) reaching genome-wide significance (p < 1 × 10⁻⁸) are colored red (novel loci) or blue (previously reported loci). Candidate genes have been identified by 1 or multiple strategies: n = nearest; c = coding nonsynonymous variant; g = GRAIL (Gene Relationships Across Implicated Loci) tool; e = expression quantitative trait loci (eQTL); and d = DEPICT (Data-Driven Expression-Prioritized Integration for Complex Traits) tool. The presence of associated eQTL, coding SNPs, deoxyribonuclease (DNAse) hypersensitivity sites, chromatin states, or transcription factor binding sites are indicated for lead SNPs (light blue) or those in high (r2 > 0.8) linkage disequilibrium (dark blue). 12LS = 12-lead sum product; Cor = Cornell voltage product; Dur = QRS duration; MAF = minor allele frequency; Sok = Sokolow-Lyon product.

