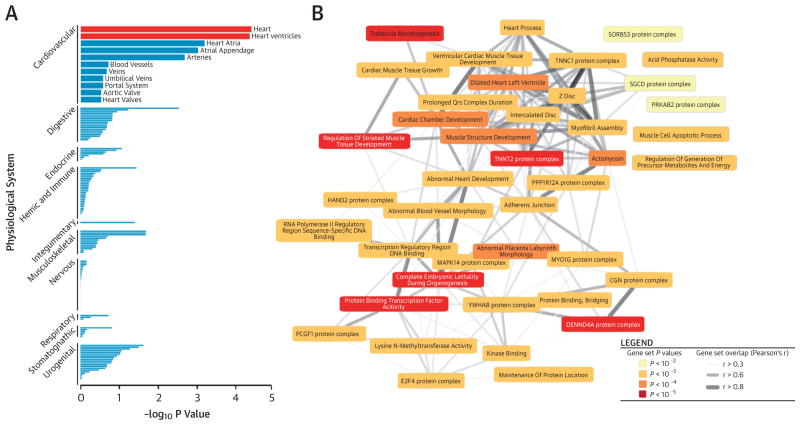
FIGURE 5. Functional Connections of Gene Expression Networks.
In the DEPICT (Data-Driven Expression-Prioritized Integration for Complex Traits) analysis, (A) plots show the enrichment of loci associated with QRS traits in specific physiological systems. (B) In a graphic display of DEPICT gene set enrichment analysis, meta-gene sets are represented by nodes colored according to statistical significance, and similarities between them are indicated by edges scaled according to their correlation (only correlations with r > 0.3 are shown).

