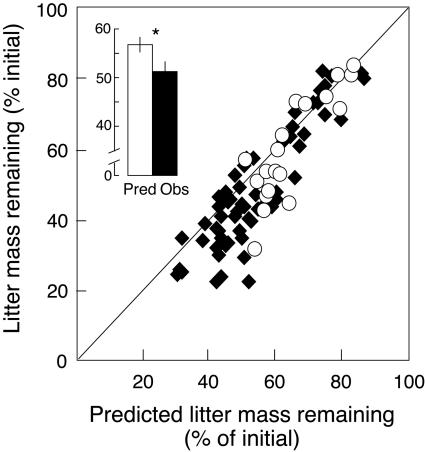
Fig. 3.
Total remaining litter mass of entire microcosms as a function of total predicted litter mass remaining. Data points represent individual microcosms either without macrofauna (open circles) or with macrofauna (i.e., millipedes, earthworms or both; solid diamonds). The line indicates the 1:1 line along which observed and predicted values are equal. Inset shows the average predicted (open bar) and observed (solid bar) total remaining litter mass across all treatments. Predicted litter mass loss of mixtures was calculated as the average of component species mass loss observed in monocultures and compared with the actual observed community litter mass.

