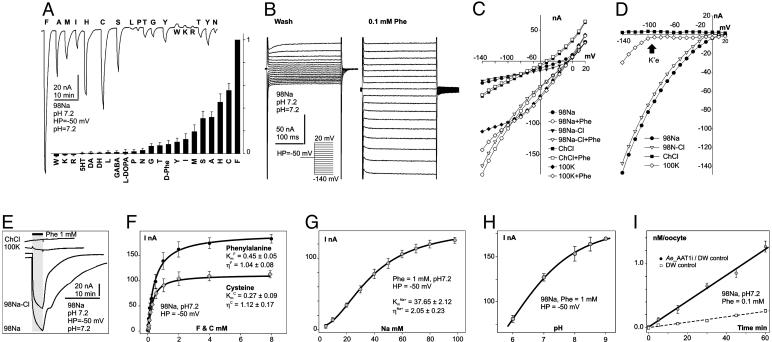
Fig. 2.
Representative electrochemical properties of aeAAT1i expressed in Xenopus oocytes. (A Upper) Amino acid-induced currents (all amino acids were presented at 1 mM final concentration for 30 sec). (A Lower) Normalized amino acid-induced responses (bars are means of normalized values ± SE; number of oocytes tested n ≥ 3 for each presented value). (B) Voltage clamp currents after application of 0.1 mM phenylalanine. (C) Representative collection of I/V plots from ion substitution experiments. Symbols with similar shapes represent pairs of a “control” (no phenyl alanine) vs. 0.1 mM phenylalanine added. (D) “Control” subtracted I/V plots. Arrow indicates a K+ equilibrium potential for Xenopus oocytes under physiological conditions. (E) Superimposed set of phenylalanine-induced currents upon ion substitutions. (F–H) Phenylalanine, cysteine, Na+, and pH dependency of substrate induced currents respectively (means of current ± SE; n ≥ 3 for each point). Data were fitted by nonlinear regression with three parameter sigmoidal function  , where Km is the apparent Michaelis–Menten constant and η is the Hill coefficient; values are shown on the graphs. (I) Phenylalanine uptake by aeAAT1i-expressing oocytes vs. water-injected “controls” (values are means ± SE, n = 3).

