
Fig. 1.
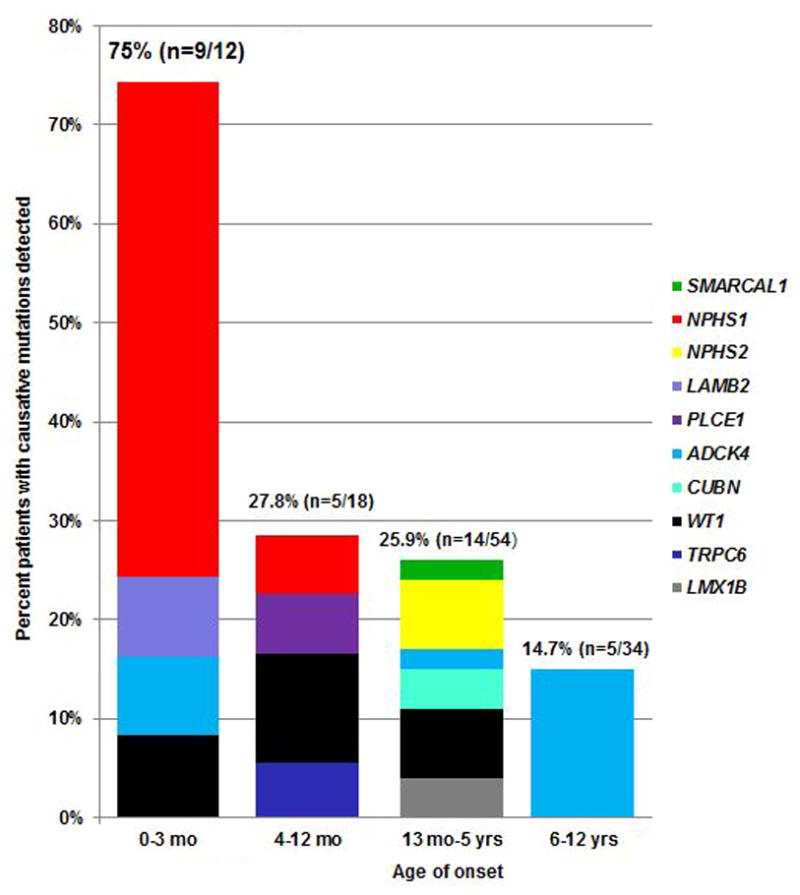
Percentage of patients with genetic diagnose per gene per age group. Histograms indicate fraction (in percentage) of patients with causative gene detected per age group.
Official websites use .gov
A
.gov website belongs to an official
government organization in the United States.
Secure .gov websites use HTTPS
A lock (
) or https:// means you've safely
connected to the .gov website. Share sensitive
information only on official, secure websites.
Percentage of patients with genetic diagnose per gene per age group. Histograms indicate fraction (in percentage) of patients with causative gene detected per age group.