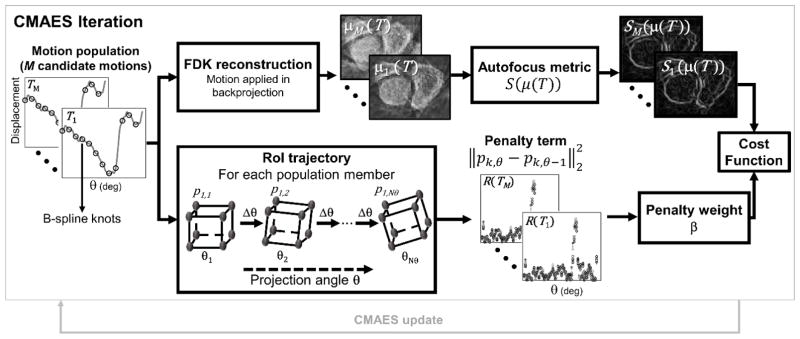
Figure 2.
Flowchart illustrating the CMA-ES optimization of the motion estimation cost function. In each iteration, M candidate motion trajectories are sampled from a random distribution. For each candidate solution, the autofocus metric and the penalty term are computed (top and bottom branches of the flowchart) and added to yield a cost function value for that trajectory.

