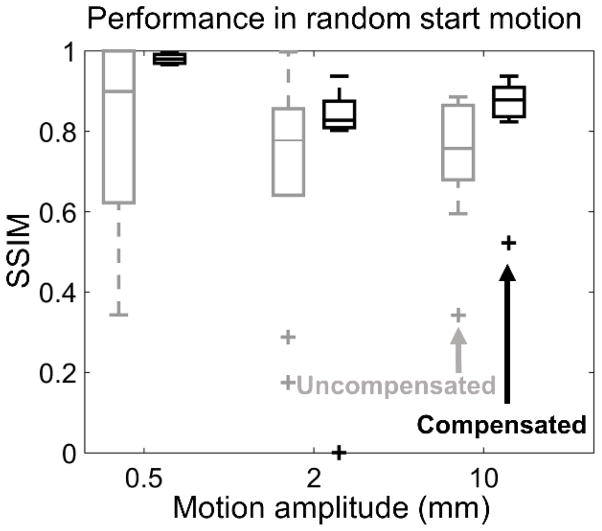
Figure 7.
Tukey boxplots are used to illustrate the distribution of SSIM values, before and after motion compensation, attained for a population of simulated motions (50 for each motion amplitude) where the starting point of the translation step was randomly selected for a range of translational motion amplitudes. SSIM was measured with respect to a static hand volume that was used to simulate the motion contaminated projections. Uncompensated reconstructions plotted in gray, compensated reconstructions in black.

