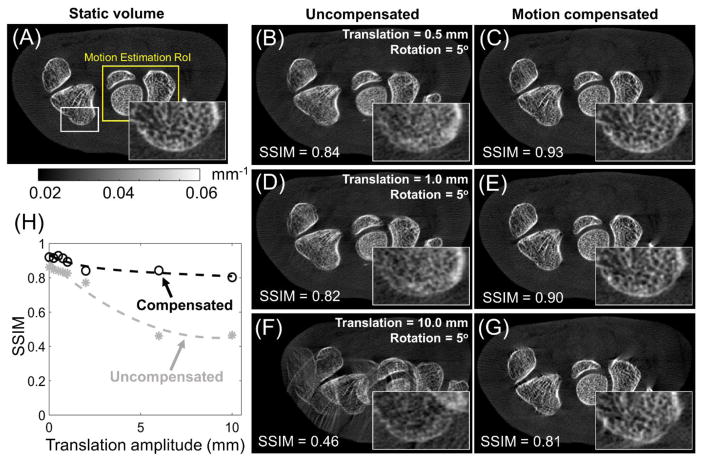
Figure 8.
Comparison between the static volume (A) and reconstructions of projections contaminated by rotation-translation motion for motion amplitudes of 0.5 mm (uncompensated reconstruction in B, motion-compensated reconstruction in C), 1.0 mm (D and E), and 10.0 mm (F and G). Motion compensation was performed using optimal parameters found for the translation motion, shown in Fig. 5. (H) Comparison of SSIM of uncompensated (gray dashed line) and motion-compensated (black dotted line) reconstructions for a range of motion amplitudes. SSIM was measured with respect to a static hand volume that was used to simulate the motion contaminated projections.

