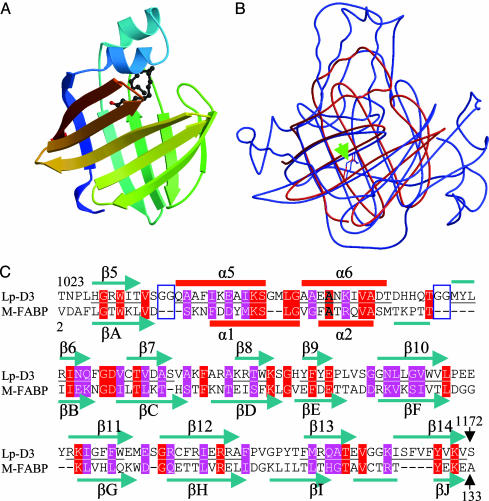
Fig. 2.
Structural similarity of D3 to FABP. (A) A ribbon diagram of M-FABP with a bound stearate (14). (B) Superposition of LCF D3 (blue) and M-FABP (red). The D3 and FABP helix–loop–helices differ, whereas the β-barrels are closely aligned. An arrow shows the location of residue 1142. (C) Alignment of primary and secondary sequences of D3 and M-FABP within the β-barrel region. Red and purple residues are identical or similar, respectively, in the two sequences. Two Gly-Gly sequences (boxes) are present in D3 but absent in M-FABP. β-Strands 5–14 in D3 correspond to strands A–J in M-FABP.

