. 2017 Jun 1;6:e26243. doi: 10.7554/eLife.26243

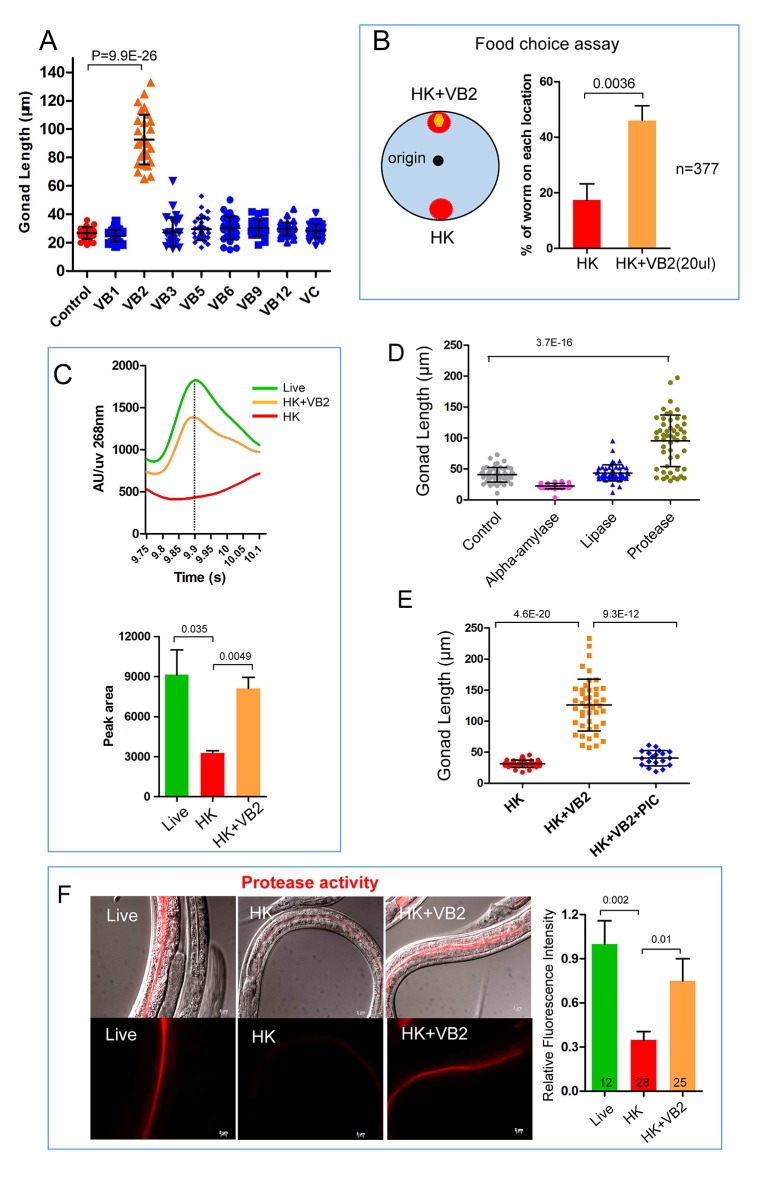
Figure 2. Vitamin B2 (VB2) supplementation increases the usage of heat-killed bacteria and promotes intestinal protease activity.

(A) Scatter plot of gonad length of worms fed heat-killed OP50 supplemented with indicated vitamins scored at Day 7. > 28 worms were scored for each sample. Representative images are shown in Figure 2—figure supplement 1A. Data are represented as mean ±SD. (B) Food-choice assay to test the effect of VB2 supplementation on animal dwelling behavior. The worms were scored for the ratio between the two locations at 3 day. Data are represented as mean ±SD. (C) HPLC-UV analysis of VB2 extracted from worms fed live, HK-OP50 and HK-OP50+VB2 supplementation. The bar graph represents the area counts of VB2 UV absorption peaks (identified by Analyst software), the mean ±SEM of three independent experiments. A graph for VB2 standard from HPLC-UV analysis is shown in Figure 2—figure supplement 2B. (D) Scatter plot showing the effect of treating HK-OP50 with indicated enzymes, on larval growth (by measuring gonad length). Only protease treatment significantly promoted growth. The number of worms scored was 52, 37, 52 and 52, respectively. Data are represented as mean ±SD. (E) Scatter plot showing the effect of a protease inhibitor cocktail (PIC) on the growth of larvae fed HK-OP50 supplemented with VB2. The number of worms scored was 32, 44 and 18, respectively. Data are represented as mean ±SD. (F) Fluorescence images and bar graph showing the impact of heat-killed bacteria and VB2 supplementation on in vivo protease activity in the intestinal tract by the EnzChek protease assay (Hama et al., 2009). L2 stage worms were incubated with quenched BODIPY TR-X casein for 3 hr before imaging. Data are represented as mean ±SEM. p-Values were calculated by T-test and p<0.05 was considered a significant difference. For bar graphs, number of worms scored is indicated in each bar. All data are representative of at least three independent experiments.

DOI: http://dx.doi.org/10.7554/eLife.26243.006

DOI: 10.7554/eLife.26243.007

Figure 2.

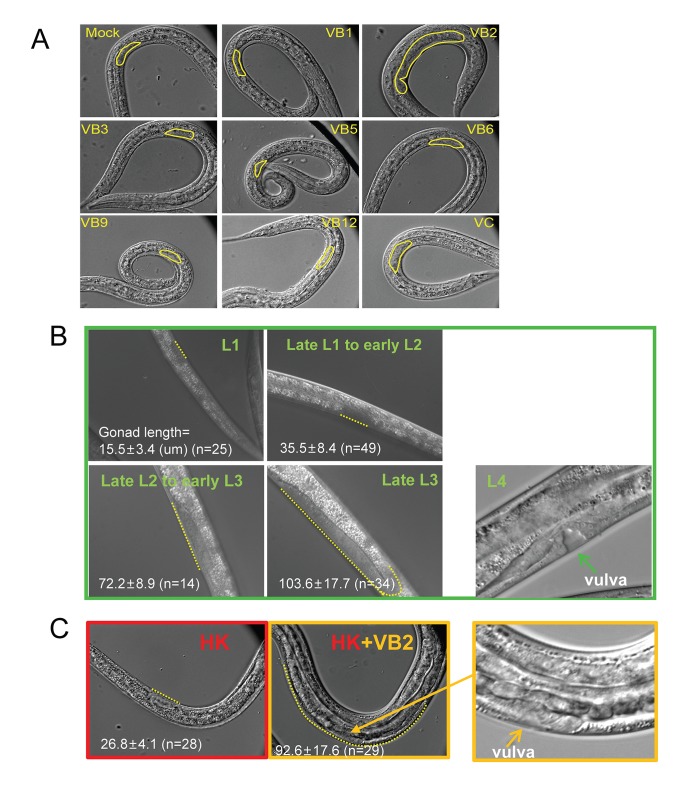
Figure 2—figure supplement 1. Gonad length of worms under different conditions.

Figure 2—figure supplement 1.

Under heat-killed bacteria feeding conditions, animals were very unhealthy so that stage progression may not correlate with growth well. Larval growth in this paper as indicated by increase in gonad length. (A) Microscopic images of larvae fed HK-OP50 with various vitamin supplements. Gonad length of each worm was measured using ImageJ at Day 7, to evaluate progression of larval growth, which reflects the consumption of the food. The statistical data are shown in the scatter plot in Figure 2A. (B) Gonad length (dotted line) of wild-type worms fed live OP50 in different developmental stages, and the vulval morphology (green arrow) of L4 worms. (C) Gonad length of wild-type worms fed HK-OP50 or HK+VB2 food. If purely based on gonad length (dotted line), worms fed HK food would be at about late L1 to early L2, worms fed HK+VB2 food would be at about late L2 to late L3 stages, comparing to well-fed worms in (B). However, the vulval morphology (yellow arrow) of some worms fed HK+VB2 food appeared to reach L4 stage.
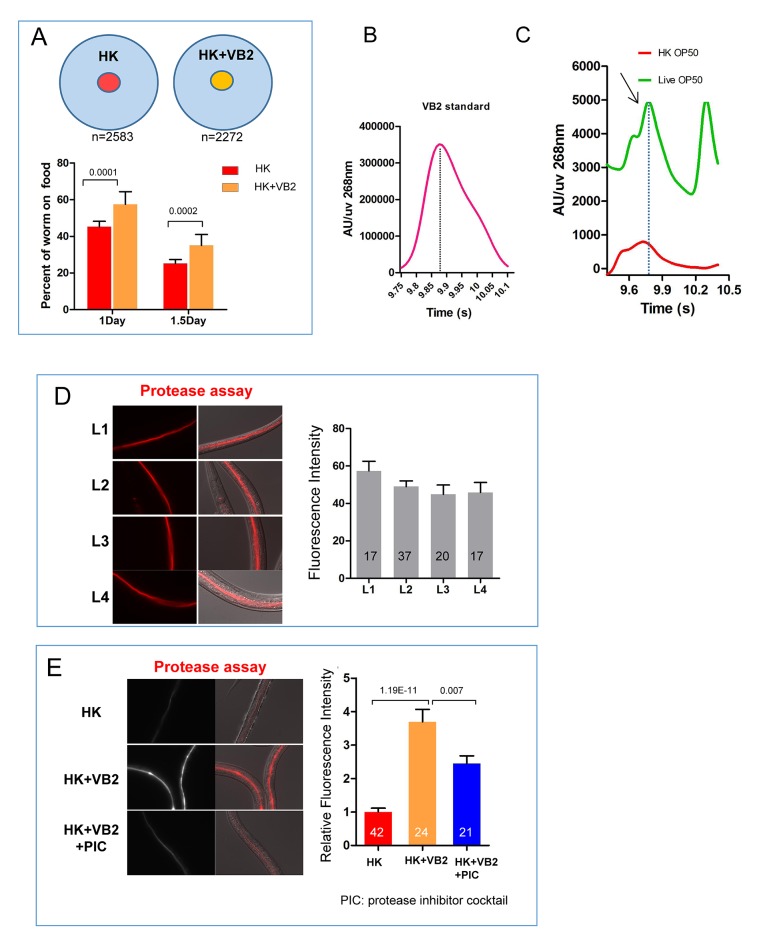
Figure 2—figure supplement 2. Impact of vitamin B2 supplementation on the ability of C. elegans to consume heat-killed bacteria.

Figure 2—figure supplement 2.

(A) Cartoon drawing and quantitative data of the food dwelling assay showing the impact of VB2 supplementation on this behavior. Yellow and red filled circles in the cartoon indicate the spots of HK-OP50 (HK) +/− VB2 supplement, respectively. L1 worms were placed on the food spot and scored for the percent that stayed within the spot after 24 hr. n=number of worms scored. Data are represented as mean ±SD. (B) Chromatograph from HPLC-UV analysis of the VB2 standard for the analysis shown in Figure 2C. (C) HPLC-UV analysis of VB2 extracted from live and heat-killed OP50. Arrow and dotted line indicate the peak of VB2. (D) BODIPY-labeled protease activity in the intestinal tract of worms fed live OP50 at four different larval stages. Fluorescence intensity was measured by ImageJ software. Data are represented as mean ±SEM. (E) Effects of VB2 supplementation and treatment of protease inhibitor on in vivo protease activity in worms fed HK-OP50. Data are represented as mean ±SEM. p Values were calculated by T-test. and p<0.05 was considered a significant difference.