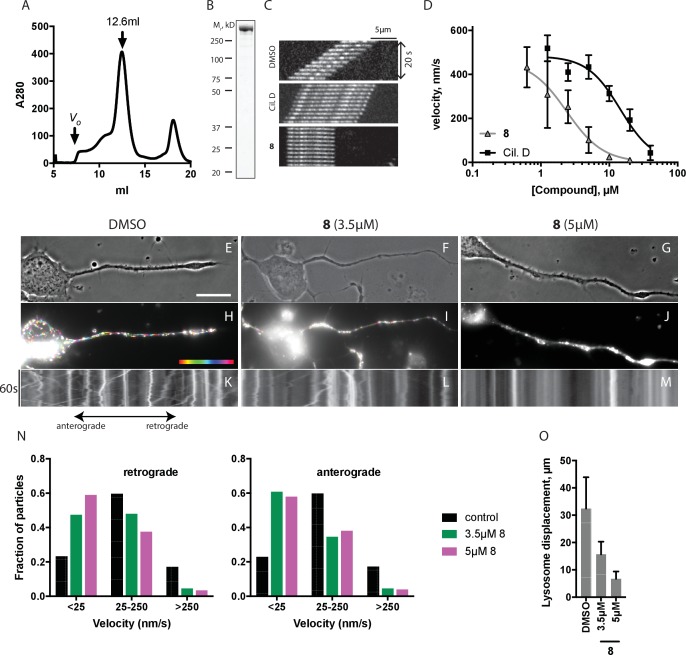
Figure 5. Inhibition of dynein 1 activity by dynapyrazole-A (compound 8).
(A) Gel filtration trace (Superose 6) for GFP-dynein 1, with volume at elution peak indicated. Vo, void volume. (B) SDS-PAGE analysis (Coomassie blue stain) of GFP-dynein 1, ~0.5 µg protein loaded. (C) Montages of fluorescent microtubules moving on GFP-dynein 1-coated glass coverslips in the presence of 1 mM ATP and either DMSO, ciliobrevin D or 8 (10µM). The interval between successive images is 2 s and total time elapsed is 20s. Horizontal scale bar, 5 µm. (D) Inhibition of GFP-dynein 1-driven motility by 8 and ciliobrevin D (mean ± S.D., n = 3). IC50 values for 8: 2.3 ± 1.4 µM (n = 3); ciliobrevin D: 15 ± 2.9 µM (n = 3). Number of microtubules quantified: 8: 20 µM-98, 10 µM-105, 5 µM-108, 2.5 µM-97, 1.3 µM-134, 0.6 µM-99, 0.3 µM-43, 0.2 µM-29; ciliobrevin D: 40 µM-64, 20 µM-74, 10 µM-82, 5 µM-79, 2.5 µM-81, 1.3 µM-87. IC50 values reported reflect the mean (± S.D.) of separate IC50 values obtained from independent dose-response analyses. Data were fit to a sigmoidal dose-response curve and the fit constrained such that the value at saturating compound >0. All motility assays were performed at 1 mM MgATP, 0.05 mg/mL casein, and 2% DMSO. Velocity distribution histograms for inhibition of dynein-1 driven microtubule motility are presented in Figure 5—figure supplement 1. Analysis of microtubule attachment to dynein-coated coverslips is presented in Figure 5—figure supplement 2. (E - J) Images of CAD cell neurites stained with Lysotracker Red. in the presence of DMSO control (0.1%), 3.5 µM and 5 µM (8). Scale bar, 10 µm. (E–G) Phase contrast microscopy images of CAD cells. (H–J) Overlay of successive images of lysosome motility in CAD cell neurites. Sixty images, spaced 1s apart, are stacked and successive images colored using FIJI according to the temporal color code shown. (K–M) Kymographs corresponding to images in H-J. The kymograph size is 60 s (vertical) by 37 µm (horizontal) and the anterograde and retrograde orientations are indicated. (N) Quantitation of lysosome velocity. (O) Quantitation of total lysosome displacement over the time course of imaging (1 min). Data are mean of n ≥ 2 experiments with ≥150 particles counted per experiment. Number of frame-to-frame velocities measured: DMSO-anterograde: 14167, DMSO-retrograde: 14973, 3.5 µM 8-anterograde: 11283, 3.5 µM 8-retrograde: 11340, 5 µM 8-anterograde: 9449, 5 µM 8-retrograde: 10458. For O, number of particles counted: DMSO-3770, 5 µM 8–2400, 3.5 µM 8–840. Error bars: S.D. (DMSO, 5 µM 8), or range of values (3.5 µM 8).
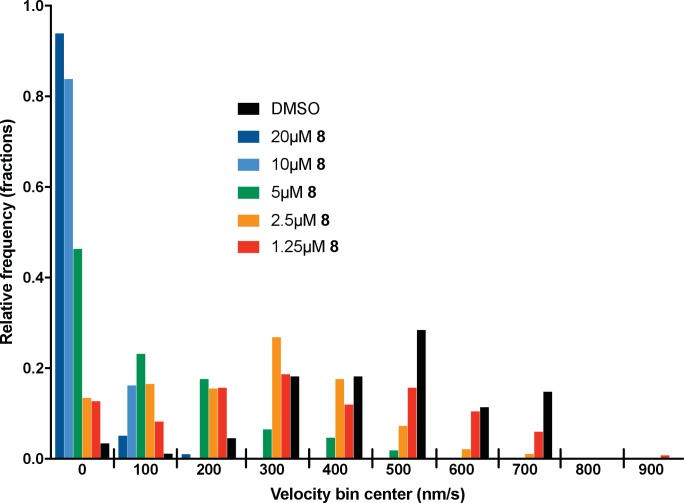
Figure 5—figure supplement 1. Microtubule velocity distribution histograms for dynein-1-driven microtubule gliding in the presence of different concentrations of compound dynapyrazole-A (compound 8).
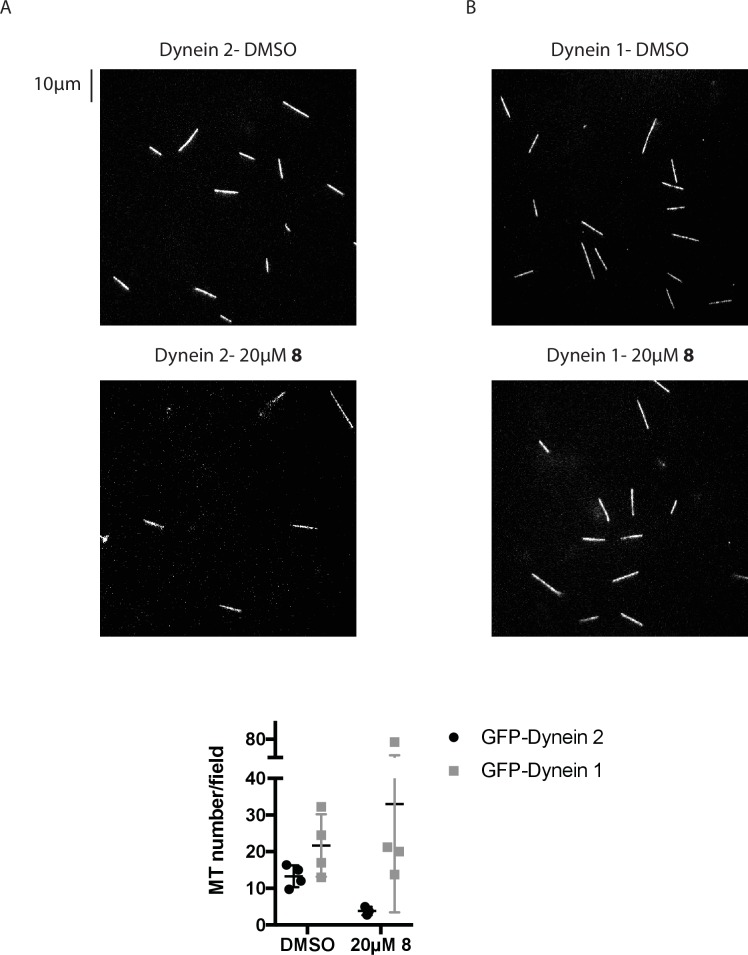
Figure 5—figure supplement 2. Analysis of the number of microtubules associated with coverslips in gliding assays.
Figure 5—figure supplement 3. Reversibility of inhibition by dynapyrazole-A (compound 8).
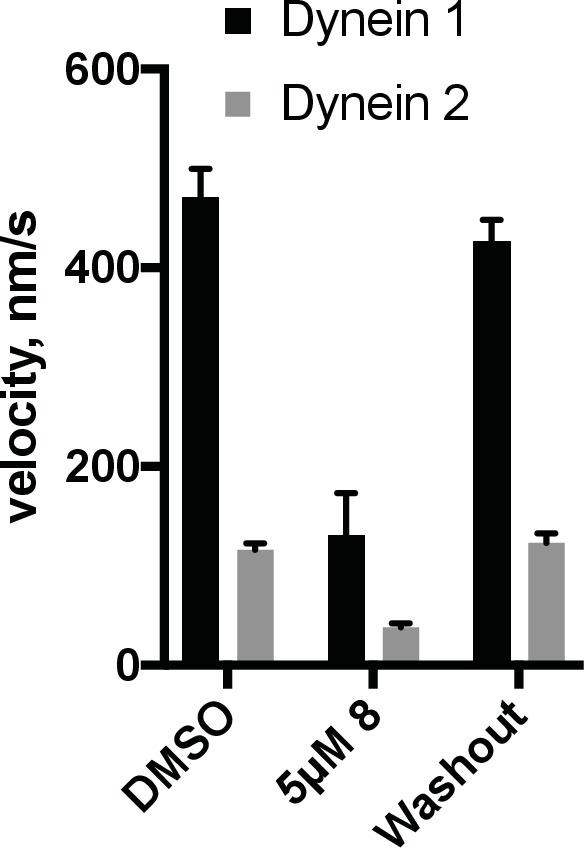
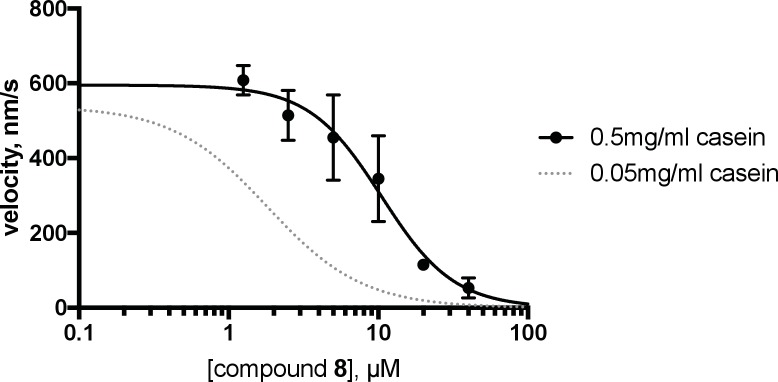
Figure 5—figure supplement 4. Analysis of the effect of blocking agent on dynein inhibition by dynapyrazole-A (compound 8).
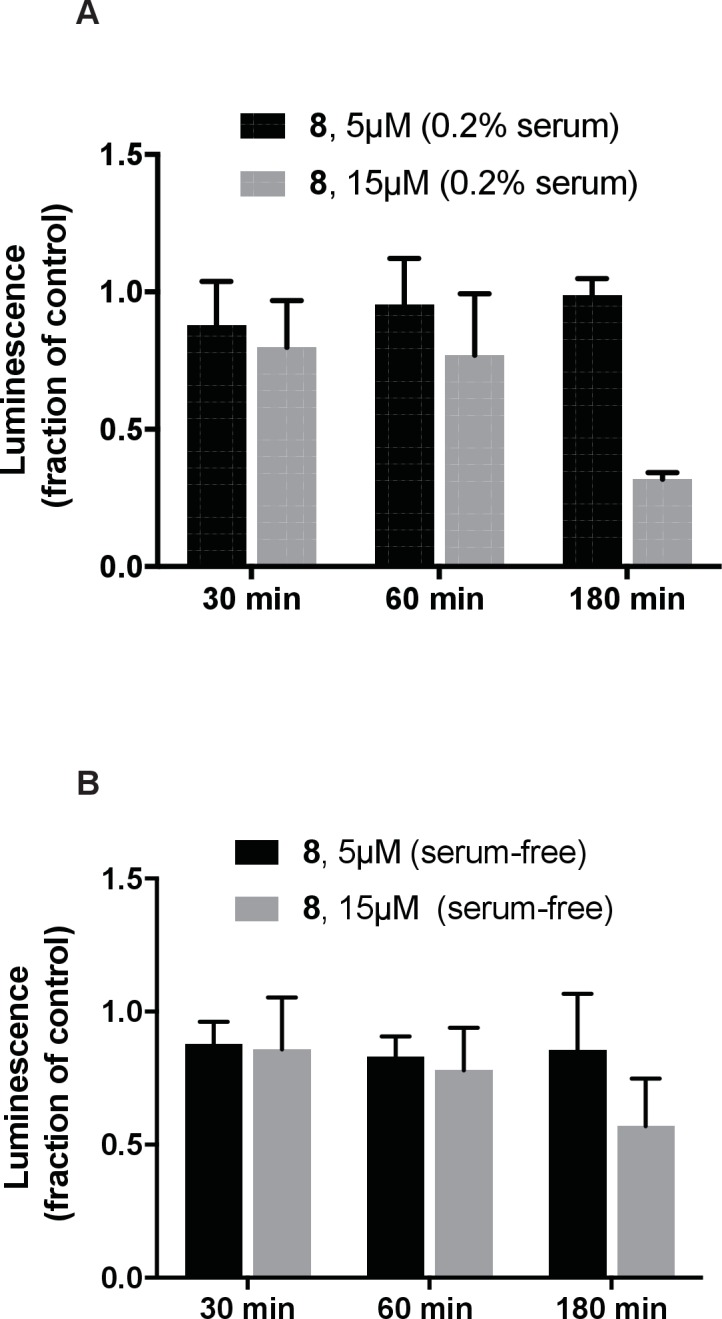
Figure 5—figure supplement 5. Analysis of the effect of dynapyrazole-A (compound 8) on intracellular ATP concentrations.
