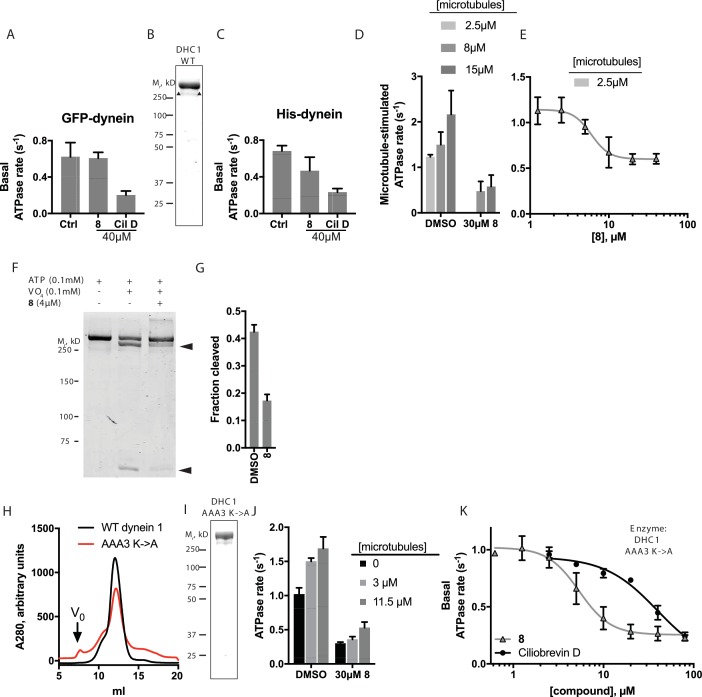
Figure 6. Analysis of the mechanism of dynein inhibition by dynapyrazole-A (compound 8).
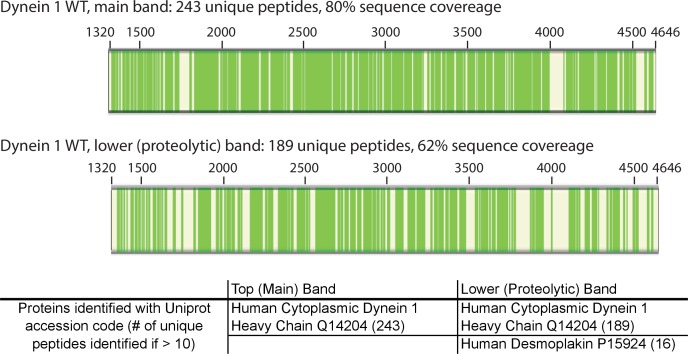
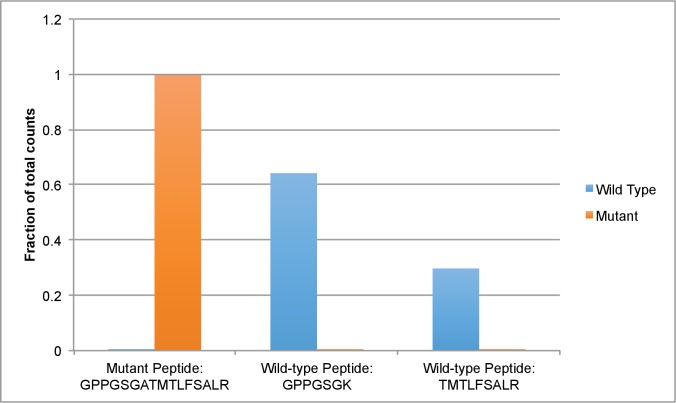
(A) Basal ATPase activity of GFP-dynein in the solvent control (2% DMSO, n = 8) and in the presence of 8 (40µM, n = 4) and ciliobrevin D (40 µM, n = 4). (B) SDS-PAGE analysis (Coomassie blue stain) of His-dynein 1, ~0.5 µg protein loaded. Mass spectrometry showed that the impurity (~15%, triangles) is likely to be a fragment of dynein (Figure 6—figure supplement 1) (C) Basal ATPase activity of His-dynein in the solvent control (2% DMSO, n = 11) and in the presence of 8 (40µM, n = 11) and ciliobrevin D (40 µM, n = 5). (D) Microtubule-stimulated ATPase activity of His-dynein 1 across a range of microtubule concentrations in the solvent control (2% DMSO) or in the presence of 30 µM 8 (2.5 µM microtubules, n = 5; 8 µM microtubules, n = 4; 8 µM microtubules, 30 µM 8, n = 3; 15 µM microtubules, 2% DMSO, n = 4; 15 µM microtubules, 30 µM 8, n = 3) (E) Dose-dependent inhibition of microtubule-stimulated His-dynein 1 ATPase activity by 8 (2.5 µM microtubules, IC50: 6.2 ± 1.6 µM, n = 3). (F) SDS-PAGE analysis (Coomassie blue stain) of dynein following irradiation with ultraviolet light at 365 nm. The components included in the photocleavage reaction loaded into each lane are indicated above the lane. Arrowheads indicate dynein photocleavage products. (G) Analysis of gel band intensity for photocleavage reactions. Values are mean + S.D., n = 3. (H) Gel filtration traces (Superose 6) for His-dynein 1 wild-type and AAA3 Walker A mutant. Peak elution volumes are 12.2, and 12.4 mL, respectively. Vo, void volume. (I) SDS-PAGE analysis (Coomassie blue stain) of Walker A mutant His-dynein 1 protein, ~0.5 µg protein loaded. Mass spectrometry data confirming the presence of the K2601A mutation in this construct is shown in Figure 6—figure supplement 4. (J) Basal and microtubule-stimulated ATPase activity of the AAA3 Walker A-mutant His-dynein 1 in the solvent control (2% DMSO) and in the presence of 8 (30µM). (K) Inhibition of the basal ATPase activity of the AAA3 Walker A-mutant His-dynein 1 by 8 (IC50: 5.5 ± 1.6 µM, n = 5) and ciliobrevin D (IC50: 38.4 ± 6.3 µM, n = 3). IC50 values reported reflect the mean (±S.D.) of separate IC50 values obtained from independent dose-response analyses. For (E) and (K), data were fit to a four-parameter sigmoidal dose-response curve in PRISM and fits were constrained such the value at saturating compound >0. All ATPase assays were performed at 1 mM MgATP and 2% DMSO. All data presented are mean ± S.D. of n ≥ 3 data points, except in K, where replicate numbers for individual datapoints were as follows. 8: 80 µM-2, 40 µM-5, 20 µM-5, 10 µM-5, 5 µM-5, 2.5 µM-5, 1.3 µM-5, 0.6 µM-2. Ciliobrevin D: 80 µM-2, 40 µM-3, 20 µM-3, 10 µM-3, 5 µM-3, 2.5 µM-3.
Figure 6—figure supplement 1. Mass spectrometry-based analysis of wild-type His-dynein 1.
Figure 6—figure supplement 2. Dose-dependent inhibition of microtubule-stimulated His-dynein 1 ATPase activity by ciliobrevin D (2.5 µM microtubules).

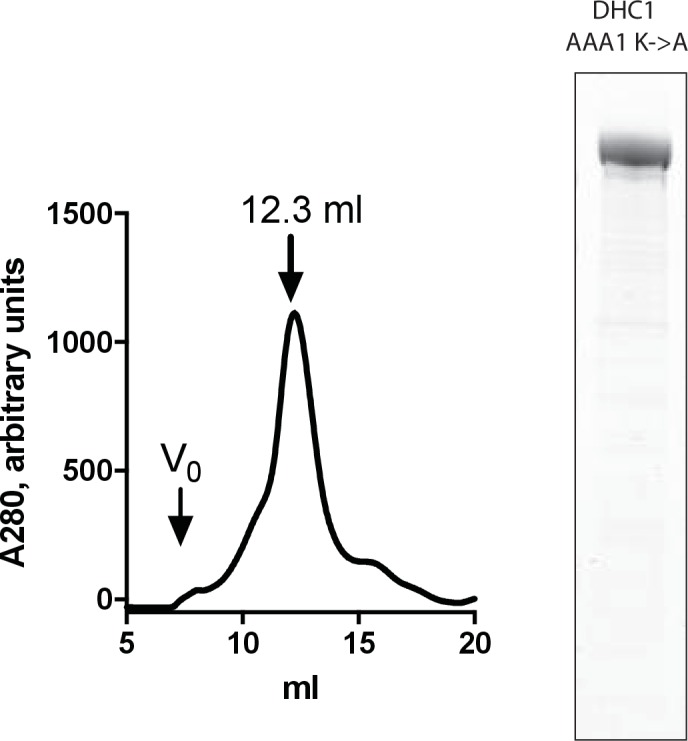
Figure 6—figure supplement 3. Purification and testing of His-dynein 1 with Walker A mutation in AAA1.
