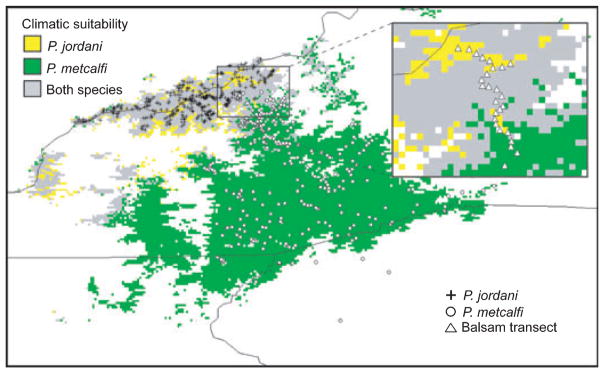
Fig. 7.
Ecological niche modelling results showing present-day predicted geographic distributions for Plethodon jordani and Plethodon metcalfi. For comparison, collection localities are shown for both Plethodon jordani (+) and Plethodon metcalfi (O). The inner box encompasses the hybrid zone and is expanded to show sampling localities (Δ) along the Balsam Mountain transect. Colours indicate habitat-suitability values as assigned by Maxent and are given as percentages (cumulative probability × 100; see text for more detail).

