. 2017 Apr 19;6:e19907. doi: 10.7554/eLife.19907

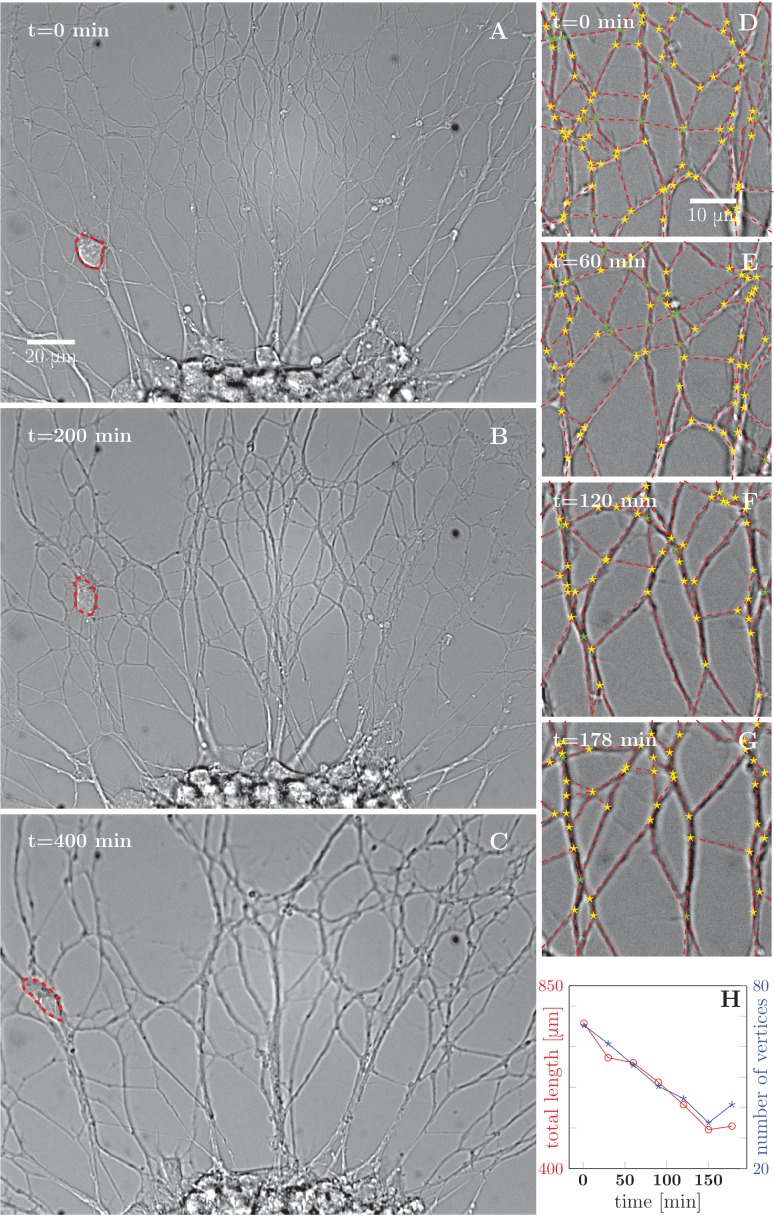
Figure 1. Progressive formation of fascicles in the evolving axon network.

(A–C) Evolution of the axonal network growing from an explant during 400-min time lapse recording, after 2 days of incubation; the red dashed outline delineates a travelling ensheating cell. Progressive coarsening of the network and decrease of total length and density can be seen. (D–G) Red dashed lines outline the edges of the network, while yellow stars indicate junctions between axons or axon bundles, and green stars indicate crossings. (H) Quantification of total length and number of vertices of the network area depicted in panels (D–G), as a function of time (based on seven manually segmented video frames). Segmentation coordinates for panels D-G and data from panel H data are available in Figure 1—source data 1.

DOI: http://dx.doi.org/10.7554/eLife.19907.003

Figure 1—source data 1. Segmentation coordinates (D–G), plot data (H).
DOI: 10.7554/eLife.19907.004

Figure 1.

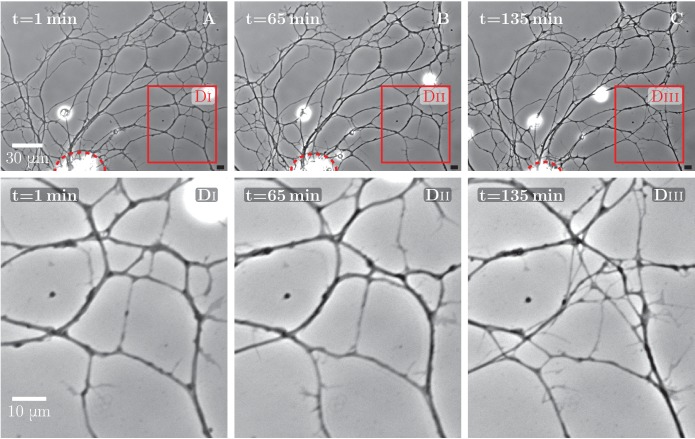
Figure 1—figure supplement 1. An example of spontaneous defasciculation correlated with explant contraction.

Figure 1—figure supplement 1.

(A–C) Full field view of network evolution, from an experiment with no added drugs. The edge of the explant is marked by the red dashed line. After t=65 min, the explant edge starts to move out of the field and pulls on the outgrown axon network. This causes defasciculation and an increase of network length in the area marked by the red square, labeled (DiDiii). The panels (Di–Diii) show magnified views of the marked area. An increase in network density is apparent in the panel Diii. The time-lapse recording spanning t=1 min through t=135 min is provided as Figure 5—source data 1.
Figure 1—figure supplement 1—source data 1. Development of axon network over 135 min, with decoarsening visible in the lower right quadrant after t=65 min, video corresponding to Figure 1—figure supplement 1.
DOI: 10.7554/eLife.19907.006