Figure 3.

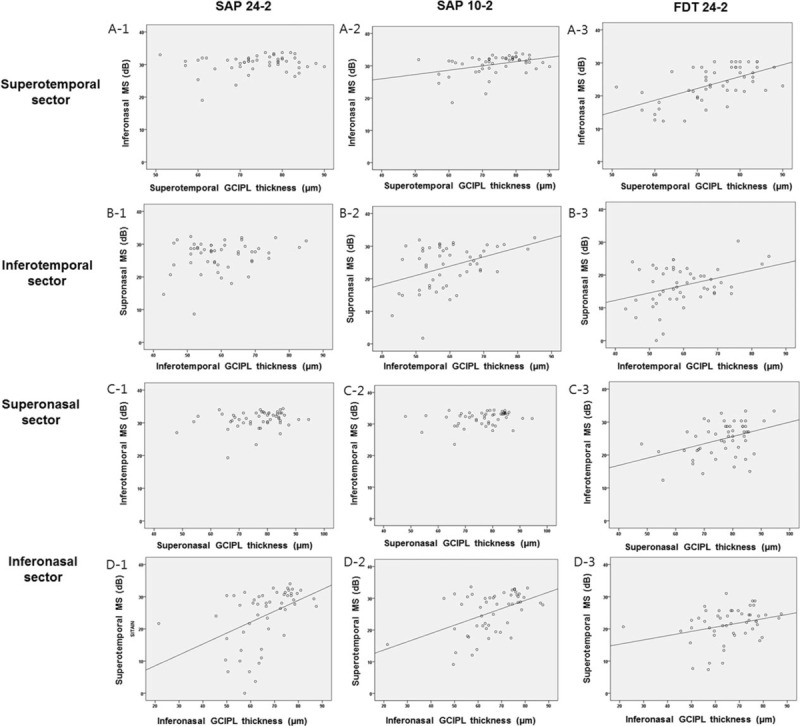
Scatter plots expressing topographical structure–function relationship in patients with isolated parafoveal scotoma on the superotemporal (A-1,2,3), inferotemporal (B-1,2,3), superonasal (C-1,2,3), and inferonasal (C-1,2,3) sectors.

Scatter plots expressing topographical structure–function relationship in patients with isolated parafoveal scotoma on the superotemporal (A-1,2,3), inferotemporal (B-1,2,3), superonasal (C-1,2,3), and inferonasal (C-1,2,3) sectors.