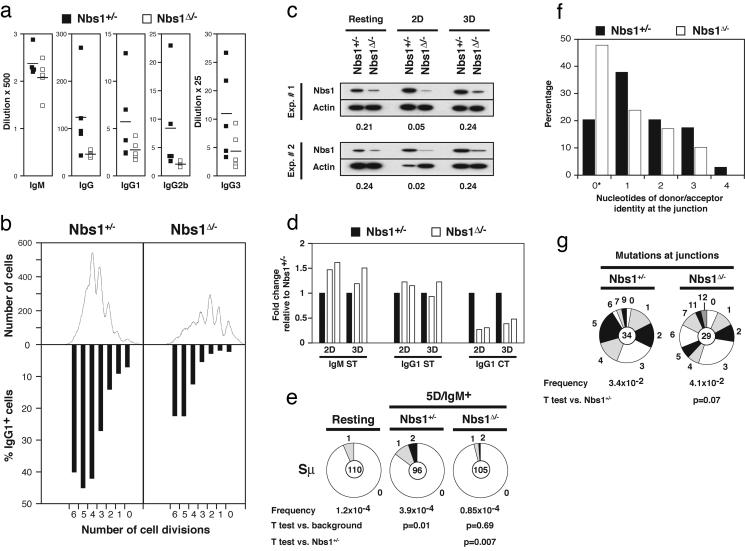
Fig. 3.
Impaired CSR in Nbs1Δ/- B cells. (a) Sera from 5- to 8-week-old Nbs1Δ/- (CD19cre+Nbs1-/loxP, □) and age-matched Nbs1+/- (CD19cre+Nbs1+/-, ▪) mice were collected, and total IgM, IgG, IgG1, IgG2b, and IgG3 levels were determined by ELISA. Data are plotted as the average dilution that gave half-maximum optical density in five mice of each genotype. (b) Flow-cytometric analysis of Nbs1Δ/- and Nbs1+/- B cells stimulated with LPS and IL-4 for 3 days. Cell division as measured by CFSE dye dilution is shown in Upper. The percentage of cells expressing IgG1 after a specific number of cell divisions is indicated in Lower. (c) Western blot analysis of murine Nbs1 in whole-cell extracts prepared from purified splenic B cells before stimulation and sorted for two or three cell divisions after stimulation with LPS and IL-4 (2D and 3D, respectively). Numbers reflect the intensity of bands representing Nbs1 protein in Nbs1Δ/- relative to Nbs1+/- after normalization to actin. Data from two independent experiments are shown. (d) Real-time RT-PCR for IgM sterile transcript (IgM ST), IgG1 sterile transcript (IgG1 ST), and IgG1 circle transcript after switch (IgG1 CT) in Nbs1+/- (filled bars) and Nbs1Δ/- (open bars) B cells stimulated with LPS and IL-4 and sorted after two or three cell divisions (2D and 3D, respectively). Results from two independent experiments are expressed as fold change relative to Nbs1+/- after normalization to GAPDH. (e) Mutations in Sμ determined in Nbs1+/- and Nbs1Δ/- IgM+ B cells sorted for five cell divisions. Segment sizes in the pie charts are proportional to the number of sequences carrying the number of mutations indicated in the periphery of the charts. The mutation frequency and the total number of independent sequences that were analyzed are indicated below and in the center of each chart, respectively. Statistical significance was determined by a two-tailed t test assuming unequal variance and by comparing with resting B cells from wild-type mice (Nbs1+/-, P = 0.01; Nbs1Δ/-, P = 0.69) or comparing Nbs1+/- with Nbs1Δ/-(P = 0.007). The number of mutations was as follows: Nbs1+/-, 20 mutations, 51,304 bp; Nbs1Δ/-, five mutations, 58,800 bp. (f) Histogram depicting the percentage of sequences with the indicated length of microhomologies at Sμ/Sγ1 junctions in Nbs1+/- (filled bars) and Nbs1Δ/- (open bars) B cells. Overlap was determined by identifying the longest region at the switch junction of perfect uninterrupted donor/acceptor identity. Statistical significance was determined by Student's one-tailed t test (P = 0.07). *, Includes junction sequences with small 2- to 4-bp insertions (Nbs1+/-,2/34; Nbs1Δ/-,4/29). (g) Mutations in the vicinity of the junctions obtained from Nbs1+/- and Nbs1Δ/- B cells. Statistical significance was determined by a two-tailed t test assuming unequal variance and comparing Nbs1+/- with Nbs1Δ/-(P = 0.28).

