
Figure 5.
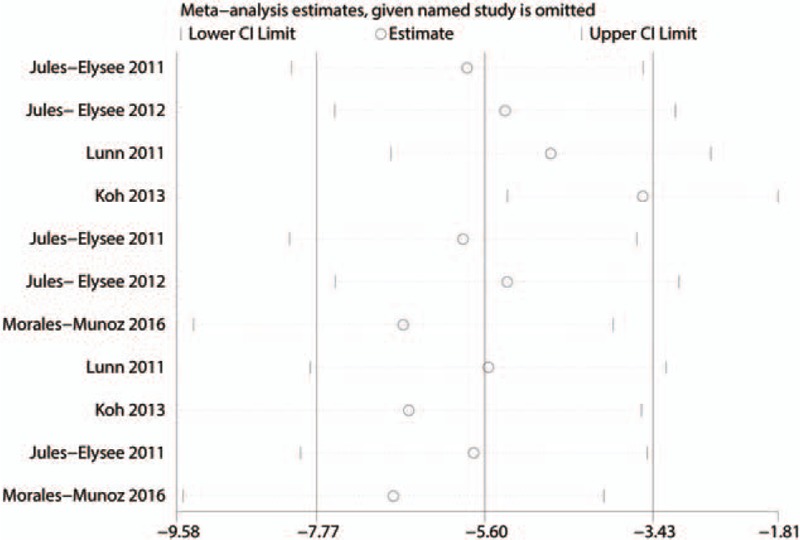
Sensitivity analysis for the differences in visual analogue scale (VAS) scores between the 2 groups after 12, 24, and 48 hours of rest.
Official websites use .gov
A
.gov website belongs to an official
government organization in the United States.
Secure .gov websites use HTTPS
A lock (
) or https:// means you've safely
connected to the .gov website. Share sensitive
information only on official, secure websites.
Sensitivity analysis for the differences in visual analogue scale (VAS) scores between the 2 groups after 12, 24, and 48 hours of rest.