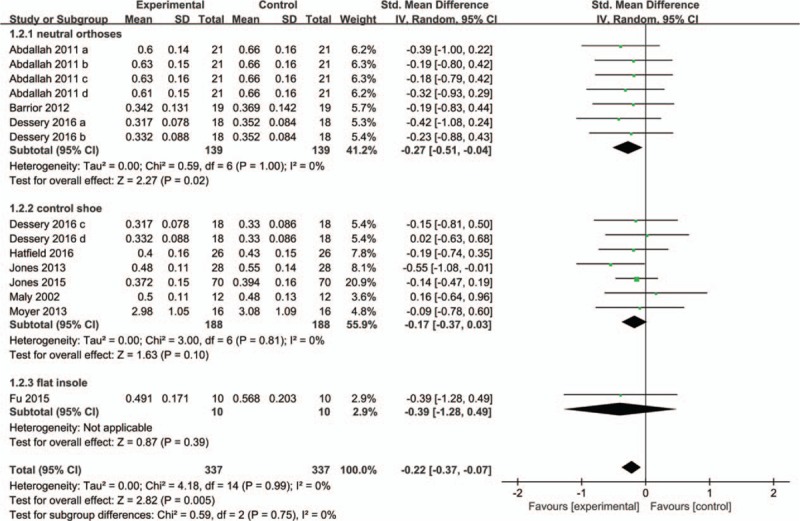
Figure 2.

Forest plot of synthetic data for the first peak external knee adduction moment. The green squares indicate the effect size of every study. The transverse lines show the 95% CI. Black diamond represents the pooled estimate of every subgroup and the total effect. CI = confidence interval, SD = standardized errors.
