Figure 3.

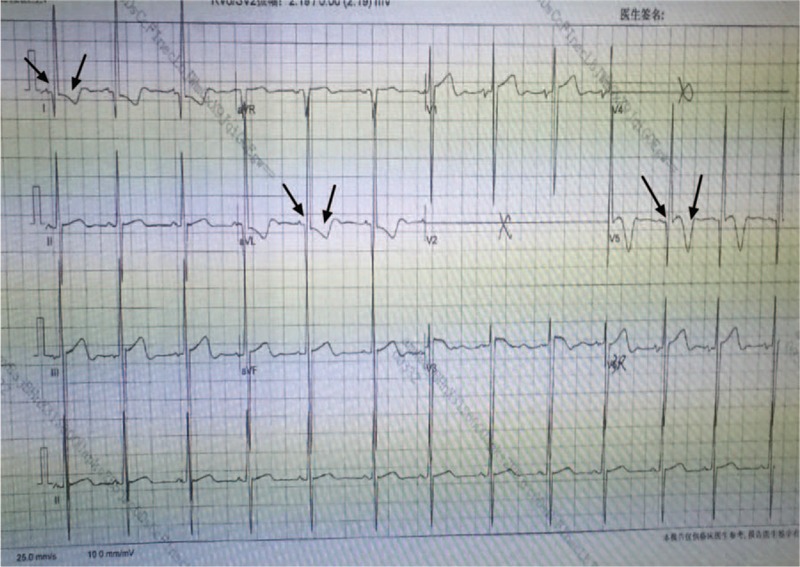
Electrocardiography showing abnormal Q waves in leads I, avL, and V5 and T waves inversion in leads I, avL, V3, and V5 in the case 2 patient.

Electrocardiography showing abnormal Q waves in leads I, avL, and V5 and T waves inversion in leads I, avL, V3, and V5 in the case 2 patient.