
Figure 4. FIREs are enriched for active enhancers and positioned near sample-specific gene expression.
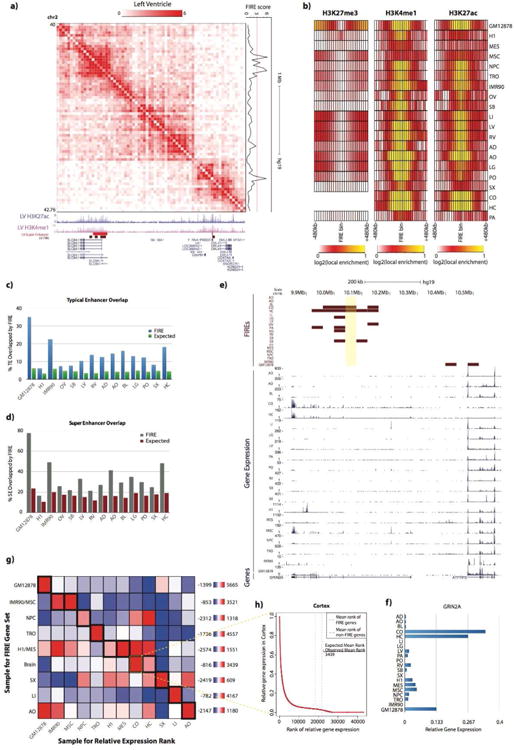
a) Normalized Hi-C contact matrix in Left Ventricle tissue showing a 2.76Mb locus (chr2:40,000,000-42,760,000). Below are genome browser tracks for previously published (Hnisz et al, 2013) LV super-enhancers (red), LV FIRE bins (brown), and UCSC genes, including isoforms (blue). To the right is the continuous LV FIRE score along this locus.
b) Heatmaps showing the local enrichment (see Supplemental Methods) of H3K27me3 (left), H3K4me1 (middle), and H3K27ac (right), centered on FIRE bins for each cell line or adult tissue. H3K27me3 data was not available for CO or HC.
c) Bar plot showing the observed overlap between actual FIRE bins and previously characterized typical enhancers (blue) (Hnisz et al., 2013) for each available cell line or tissue that has both Hi-C data and typical enhancer calls. Expected values are also shown (green), which are calculated by permuting the location of FIRE bins within each tissue and calculating the overlap with typical enhancers. The y-axis shows the percentage of typical enhancers overlapped by FIREs.
d) Same as Panel c, except showing the percentage of super-enhancers overlapped by FIRE bins for each testable cell line or tissue.
e) Genome browser snapshot showing an example of sample-specific gene expression near sample-specific FIREs. Shown here is a 780kb locus (chr16:9,820,000-10,600,000) around GRIN2A (chr16:9,852,375-10,276,611). At the top, FIRE tracks (maroon) for each sample, showing the Brain-specific FIRE (chr16:10,040,000-10,080,000, highlighted in yellow) ∼197kb away from GRIN2A TSS. Below, RNA-Seq data (Roadmap Epigenomics Consortium et al, 2015) for all samples except OV (blue) showing GRIN2A is mainly expressed in brain tissues.
f) Bar plot indicating the relative gene expression (see Supplemental Methods) of GRIN2A across 20 samples.
g) All-by-all mean-rank enrichment analysis result showing gene expression specificity of genes within 200kb of sample-specific FIRE bins (see Supplemental Methods). Each row is a different sample type for which the sample-specific FIRE gene set is collected, and columns are the sample type used to calculate the relative expression rank of each gene. IMR90/MSC, M1/MES, and brain tissues were previously shown to have highly overlapped FIRE bins (Figure 3a) and are therefore grouped. Color for each row of the heatmap indicates the enrichment. Outlined in thick black boxes along the diagonal are the matrix entries for which the sample for the sample-specific FIRE gene set and expression rank list are the same. Highlighted in a thin yellow box is the analysis portrayed in Panel h.
h) Line plot illustrating a single mean-rank enrichment analysis. The plot shows the relative gene expression values (y-axis) in Cortex as a function of their numeric ranking (x-axis) in Cortex. Vertical dashed lines show the position of the observed mean-rank of Cortex-specific FIRE genes (red dash), and the expected mean-rank based on size-matched randomly selected non-FIRE bins in Cortex (gray dash). Inset is the calculation of enrichment score.