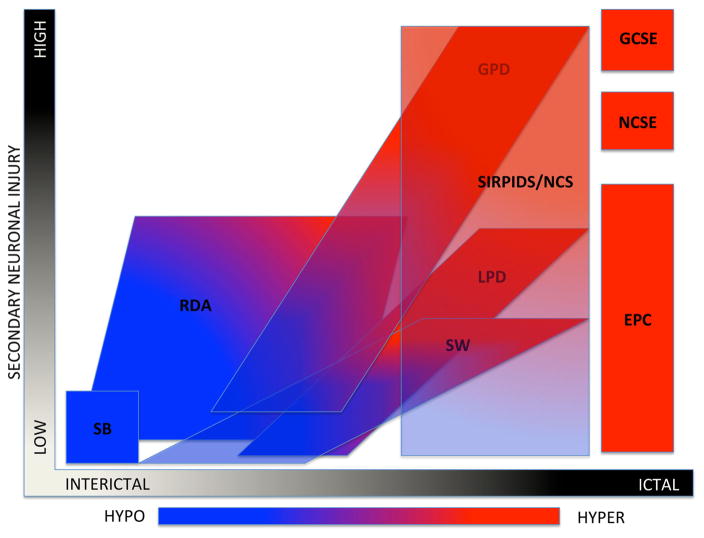
Fig. 2.
The ictal-interictal-injury-metabolism continuum. This diagram is a graphic conceptualization adapted from Chong and Hirsh [24] using the current ACNS terminology and with the addition of PET metabolism ranging from hypo/normo metabolic in blue to hypermetabolic in red. This conceptualization is meant only to reflect scalp EEG patterns. X-axis represents the spectrum of interictal to ictal, i.e., the spectrum of cerebral dysfunction, which is potentially reversible with anti-seizure treatment. Y-axis is secondary neuronal damage attributable to the EEG pattern. SB suppression burst, RDA rhythmic delta activity, LPD lateralized periodic discharges, SW spike wave, GPD generalized periodic discharges, SIRPIDs stimulus-induced rhythmic, periodic, or ictal discharges, NCS non-convulsive seizures, GCSE generalized convulsive status epilepticus, NCSE non-convulsive electrographic status epilepticus, EPC epilepsia partialis continua, HYPO hypometabolism, HYPER hypermetabolism (Color figure online)

