Abstract
Micromachined fluid-filled variable impedance waveguides intended to mimic the mechanics of the passive mammalian cochlea have been fabricated and experimentally examined. The structures were microfabricated with dimensions similar to those of the biological system. Experimental tests demonstrate acoustically excited traveling fluid-structure waves with phase accumulations between 1.5 and 3 π radians at the location of maximum response. The resulting measured frequency-position mapping function, with similarities to that observed in the cochlea, is presented. Results for both isotropic and orthotropic membranes are reported, demonstrating that the achieved orthotropy ratio of 8:1 in tension is insufficient to produce the sharp filtering observed in animal experiments and many computational models that use higher ratios. It is also shown experimentally that high viscosity fluids must be used to provide sufficient damping to avoid the formation of a nonphysiological standing wave pattern. A mathematical model incorporating a thin-layer viscous, compressible fluid approximation coupled to an orthotropic membrane model is validated against experimental results. The work presented herein is motivated by the possibility of producing microfabricated cochlear-like filters, thus the structure is designed for production in a scalable microfabrication process.
Keywords: acoustic, micro-electro-mechanical systems, sensor, viscosity
The cochlea is the organ in the inner part of the mammalian ear that is responsible for the transduction of acoustic signals into neurological signals. The typical human cochlea operates over a 3-decade frequency band, from 20 Hz to 20 kHz, covers 120 dB of dynamic range, and can distinguish tones that differ by <0.5% (1). The cochlea is also very small, occupying a volume of ≈1 cm3. Perhaps most importantly, the cochlea uses a mechanical process to separate audio signals into ≈3,500 channels of frequency information. Thus, the cochlea is a sensitive real-time mechanical frequency analyzer.
The effectiveness of the cochlea as a time-frequency analyzer motivates our efforts to construct a hydromechanical analog that can be fabricated repeatably and in a batch fashion. Integration of sensing elements with the mechanical structure would result in a combined acoustic sensor/filter with a unique operating modality. During the design of the mechanical structure, we also learn more about some aspects of the biological cochlea.
von Békésy's (2, 3) observation of traveling waves on the basilar membrane (BM) of cadaver cochleae motivated the construction of a number of physical models of the cochlea. The first group of these models involved scaled-up versions of the cochlea. Helle's (4) model is seven times life size and exhibits tonotopic structure in the 25- to 800-Hz band. Chadwick et al. (5) built a 24 times life-size model and clearly show strong standing wave patterns and the resulting discrete resonances. Because of the standing wave nature of their response, a tonotopic map is not demonstrated (5). Lechner's (6) model is 14 times life size and demonstrates experimentally the improved filter sharpening and nonlinear compression that result from adding nonlinear feedback forcing of the structure.
A few microscale models with life-size dimensions have been reported. Zhou et al. (7) demonstrate a tonotopic map over the 300- to 15-kHz band, with phase accumulations of approximately π radians at the location of maximum response. Despite its small size, their model was not fabricated by using scalable batch micromachining methods. Additional work in recent years by Hemmert et al. (8) and Lim et al. (9) demonstrates fluid structure traveling waves in life-size cochlear models. Both of these models use a micromachined structure for the cochlear partition but a conventionally machined housing for the fluid ducts.
The results reported in this article take the next step in the development of physical cochlear models. In this work, we demonstrate, through both theory and experiment, that a fully micromachined cochlear analog can achieve a cochlear-like phase response and a place-to-frequency map. The effects of both membrane orthotropy and fluid viscosity on the sharpness of the mechanical filter and the place-frequency map are explored experimentally and mathematically. The batch micromachining process used to fabricate the system will allow future integration of sensing elements into the structure to economically produce low-power, micromechanical, cochlear-like sensor/filters.
Cochlear Model Design
The cochlea is a spiral-shaped organ consisting mainly of ducts filled with ion-rich water-like fluids. Acoustic energy is injected from the outer and middle ears. A fluid-structure wave then travels down the length of the cochlear spiral, interacting with the microstructures in the organ of Corti and the BM. The helicotrema provides pressure equalization at the apex of the cochlea (10).
The BM changes in width, thickness, and stiffness along the length of the cochlear spiral. Because of its changing mechanical impedance, high-frequency sounds excite amplified BM motion near the base of the cochlea (close to the stapes), and low-frequency sounds excite motion near the apex of the cochlea (the termination of the cochlear spiral). In addition, the BM is orthotropic, as it is stiffer transversely than longitudinally because of transversely oriented fibers and transversely arranged supporting cells in the organ of Corti (11). This orthotropy is thought to enhance filter sharpness, particularly at high frequencies. Schematics and additional description of the physiology can be found in Dallos et al. (1) and Geisler (10).
The simplest mechanical analog of the cochlea is a single fluid-filled, rigid-walled duct constrained along one side by a variable width membrane or plate. A number of authors have argued that the coiling of the cochlea is a secondary effect (12, 13), and so is neglected. Recent work by Manoussaki and Chadwick (14) explores the effects of coiling in detail. Use of a single uncoiled fluid duct rather than two coiled ducts reduces the complexity of the fabrication process considerably and facilitates mechanical measurements. A single-duct physical model corresponds to a mathematical model of the cochlea where only antisymmetric pressure contributions are included (15).
In the human cochlea, the scala height varies from as much as 2 mm at the base to <0.5 mm at the apex (16). The duct height for our engineered model is a constant 0.11 mm because of fabrication limitations. This height is similar to the scala height at the apex, but is as much as 20 times smaller than the basal height. The reduced duct height results in increased fluid mass loading of the membrane, thereby reducing response frequency. It also reduces the overall response amplitude and increases the effects of viscous damping.
Computations indicate that increasing the duct width sharpens the response of the filter, until the duct is more than approximately three times the width of the membrane, beyond which increasing the duct width has little further effect. The duct width was chosen to exceed this width, also allowing space for the fluidic interconnect ports. Pure silicone oil with either 5 or 20 centiStokes (cSt) viscosity is used to fill the duct.
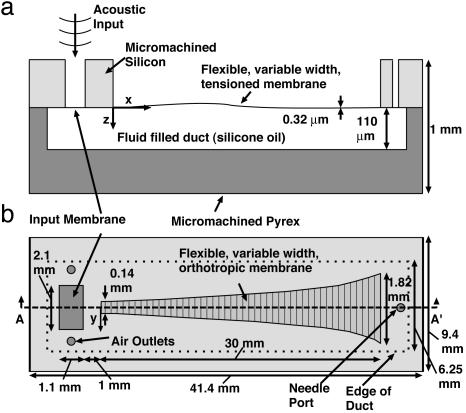
The following types of micromachined membranes corresponding to the BM have been fabricated: (i) an isotropic 0.32-μm-thick stoichiometric low-pressure, chemically vapor deposited (LPCVD) silicon nitride membrane and (ii) a composite membrane consisting of 0.32-μm-thick LPCVD silicon nitride beams overlaid by a 1.4-μm-thick low-stress photodefineable polyimide layer [HD Microsystems (Parlin, NJ) PI2737]. In the orthotropic membrane, each beam is 15 μm wide and separated from its neighbors by 5-μm gaps. Both membranes taper exponentially from 0.14 to 1.82 mm in width. Wafer curvature measurements indicate a residual stress of 1 GPa in the silicon nitride for LPCVD films deposited on silicon. This finding agrees, within 30%, to two other measurements conducted for wafers with similar film thickness in the same furnace but different runs. The polyimide is expected, based on the manufacturer's data, to have a cured residual stress of 18 MPa. Thus, the isotropic membrane is expected to have a tension of ≈320 N/m, the orthotropic a tension of 30 N/m longitudinally, 240 N/m transversely. For the given tapered geometry, this tension corresponds to a volume compliance per unit length of ≈10-15 to 10-12 m4/N, defined as the integral of the displacement across the membrane width for a uniformly applied pressure. The measurements of von Békésy (3) on human cadavers show 10-12 to 10-10 m4/N volume compliance per unit length 24 h postmortem. The lower compliance present in our model results in response in the slightly ultrasonic regime (4-35 kHz), despite the higher mass loading caused by the lower duct height.
The ratio of 8:1 in tension results in a computed ratio of 3:1 between the transverse and longitudinal space constants for a point load applied to the membrane centerline. This computed longitudinal space constant is 8 μm (21 μm) close to the base and 38 μm (106 μm) close to the apex for the orthotropic (isotropic) membrane. These space constants are similar to the 10-μm (base) and 50-μm (apex) measurements made on the gerbil BM (17). We are not aware of any quantitative measurements of orthotropy on the human BM, although Voldrich's (18) measurements indicate qualitatively that the human BM is orthotropic.
A 1.1-by-2.1-mm “input” membrane is fabricated before the start of the tapered membrane, as shown in Fig. 1. This structure serves as an acoustic input to the system. For the isotropic devices it is also isotropic silicon nitride. For the orthotropic devices it is isotropic silicon nitride overlaid with isotropic polyimide. All additional geometric parameters for the fabricated device are given in Fig. 1.
Fig. 1.
Schematic (not to scale) of the cochlear analog device. (a) Cross-sectional cut along design centerline. (b) Top view of the design. A key feature is the exponentially tapered membrane width, which provides the varying acoustic impedance needed for cochlear-like frequency-position mapping. The width of the tapered membrane has been intentionally scaled up with respect to the rest of the drawing to improve visibility.
Microfabrication
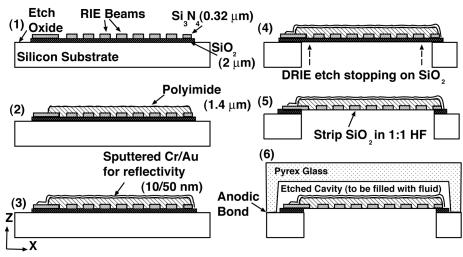
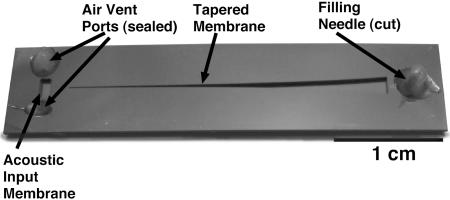
The fabrication process is diagrammed in Fig. 2. Surface layers are first deposited and patterned to create the membrane structure. This includes etching of the beams and polyimide deposition to produce the composite membrane. The wafer is then etched through from the backside by using deep reactive ion etching to define the membrane geometry. A fluid duct is etched into the Pyrex wafer by using concentrated (49%) hydrofluoric acid. The individual silicon and Pyrex dies are then anodically bonded together. A syringe needle is bonded into the filling port with epoxy and used to inject silicone oil into the duct. The needle is cut, and the filling and exhaust ports are sealed with epoxy. For production of the isotropic membrane devices, an identical process is followed, with the exception that the silicon nitride is not etched into beams, nor is it covered with a layer of polyimide. A photograph of a device fabricated by using this method is shown in Fig. 3.
Fig. 2.
Schematic of the fabrication process. RIE, reactive ion etching; DRIE, deep RIE.
Fig. 3.
Photograph of a finished device, after bonding, filling with fluid, and sealing. Hardened epoxy is visible sealing the fluid ports.
Experimental Methods
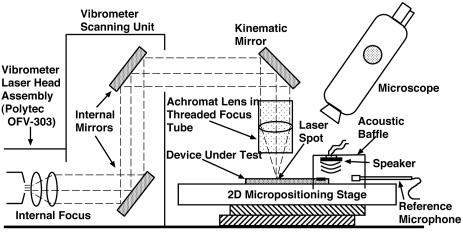
The apparatus used for measurement of structural motion is diagrammed in Fig. 4. A laser Doppler velocimeter [Polytec (Tustin, CA) OFV-303 sensor head] is used to measure out-of-plane structural velocity. A lens is used to focus the beam to a spot size of <20 μm. The sample under test is mounted on a 2D computer-controlled micropositioning stage. Aluminum clamps with a thin layer of neoprene rubber are screwed down, clamping the sample along its two long edges.
Fig. 4.
Schematic of the experimental setup.
An acoustic baffle with an internally mounted electromagnetic speaker fits over the front end of the device. The baffle ensures that acoustic energy delivered by the speaker impinges primarily on the input membrane of the sample under test while enabling direct optical interrogation of the tapered membrane. A Larson-Davis (Provo, UT) 2520 0.25-in diameter microphone is mounted inside the baffle. The exact position of the microphone inside the baffle has an effect on the measured pressure level, particularly for the higher-frequency experiments. The uncertainty in the magnitude of the delivered pressure is 10 dB. Drive levels are between 85 and 105 dB re 20 μPa.
At each drive frequency, structure velocity is measured at 1,400 data points in a 7 × 200 grid over the area of the exponentially tapered membrane. A DSP lock-in amplifier [Stanford Research (Sunnyvale, CA) SR830] is used to determine the magnitude and phase, relative to the speaker drive voltage, of the structure velocity at the excitation frequency. The noise floor of the measurements is ≈0.01 nm.
Experimental Results
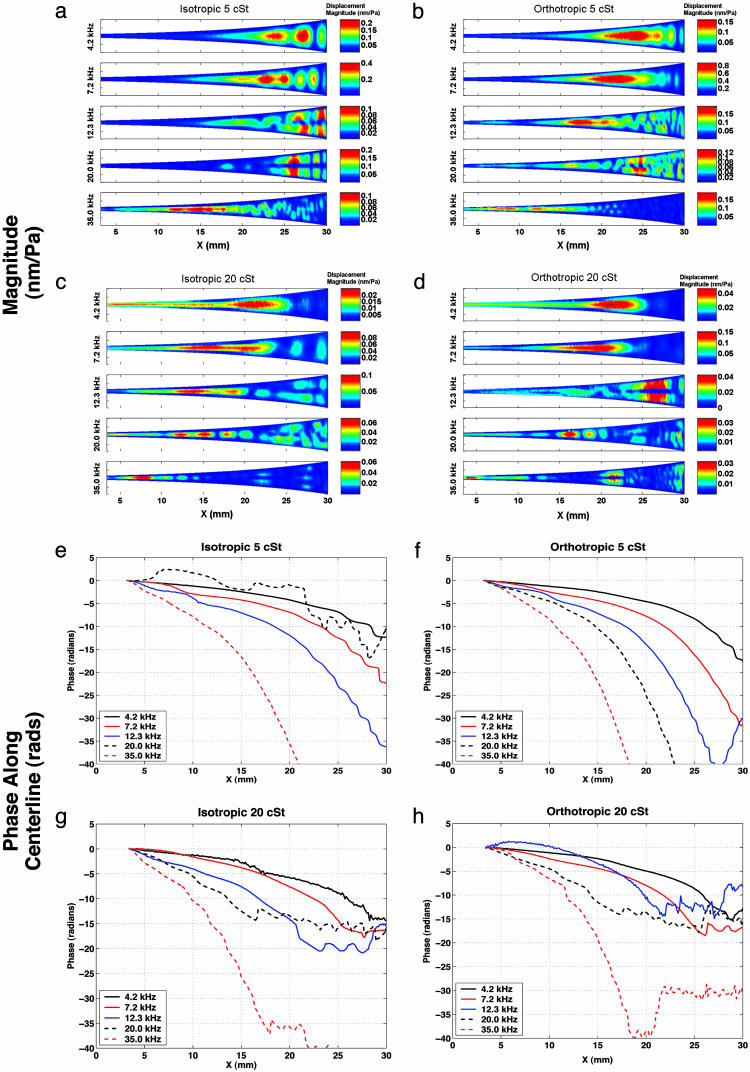
Results are presented for both isotropic and orthotropic membrane devices, filled with either 5- or 20-cSt silicone oil. Each set of results is for a unique device, but all devices come from the same wafer. Fig. 5 shows measurements of the magnitude and phase of membrane response for five driving frequencies. The phase is reported along the centerline of the membrane.
Fig. 5.
Experimental results show magnitude and phase of membrane displacement response at five excitation frequencies, normalized to the input acoustic pressure, for isotropic membrane with 5-cSt fluid (a and e), orthotropic membrane with 5-cSt fluid (b and f), isotropic membrane with 20-cSt fluid (c and g), and orthotropic membrane with 20-cSt fluid (d and h). Note that because of optical constraints the entire membrane is not imaged; the data start at 4 mm from the narrow end of the device. Centerline plots of the magnitude results are available in Fig. 9, which is published as supporting information on the PNAS web site.
A cochlear-like frequency position map is present, as seen in the magnitude data. The best example is shown in Fig. 5c. At 4.2 kHz, the peak response occurs at 21 mm, with the peak moving to a location of 7.5 mm for a 35-kHz drive. The orthotropic cases show only slight sharpening of the response at 4.2 and 7.2 kHz, as seen by a comparison of Fig. 5 c and d. For some cases, most notably 12.3 and 20 kHz in Fig. 5a and 12.3 kHz in Fig. 5d, second structural cross-modes are present. This type of response is antisymmetric with a nodal line on the membrane center. The maximum response of this second mode occurs at a location closer to the wide end of the membrane than does the maximum first mode response.
The fluid-structure waves are predominantly traveling waves, as seen from the phase response in Fig. 5 e-h. At the location of maximum response for the first symmetric structural mode, the total phase accumulation is in the range of 5 to 10 radians. For the lower viscosity cases at 4.2 and 7.2 kHz, a partial standing wave pattern is generated close to the reflecting boundary at 30 mm. This pattern can be seen from the π steps in phase appearing between 20 and 30 mm in Fig. 5 e and f. Increasing the viscosity to 20 cSt causes the waves to damp out more rapidly after reaching the location of maximum response, suppressing the standing wave pattern.
One set of experiments (for the 20-cSt orthotropic case) was repeated after a 3-month interval. At four frequencies, the phase results and the shape of the magnitude response were identical. At 20 kHz, a backward-propagating, rather than forward-propagating, traveling wave was excited, perhaps caused by changes in the precise alignment of the speaker. The absolute magnitude of the response, relative to the measured excitation pressure amplitude, varied by <10 dB from the set of experiments shown here. This variation probably is caused by uncertainties in the measurement of the excitation level. At 4.2 and 7.2 kHz, additional tests were conducted with drive levels two and three times the initial drive level to test the linearity of the system. No level-dependent change was observed in the phase or relative magnitude response.
Modeling
Mathematical modeling of this system requires the solution of a coupled fluid structure problem. Many other authors have described mathematical models of the passive cochlea, both analytical and numerical. Steele and Taber (19) and de Boer and Viergever (20), among others, present 3D cochlear models by using the Wentzel-Kramer-Brillouin asymptotic technique. A number of finite element models of the cochlea have also been described, such as those by Parthasarathi et al. (15), Kolston and Ashmore (21), and Kagawa et al. (22). A direct application of these methods is not appropriate for the system considered in this study because the viscous boundary layer occupies a large fraction of the 110-μm duct height, causing these approaches to underestimate the viscous fluid damping.
The finite element model described herein is taken from Beltman et al. (23). This model couples a thin, viscous, compressible acoustic medium to a structure, differing from the majority of cochlear models by focusing on viscous fluid effects. The thin gap approximations are valid for fluid film heights much less than any dimension of the response. In the case considered here, the wavelength of the response in the longitudinal direction is always >2 mm, 20 times the fluid height. The variation of the response in the transverse direction occurs over the membrane width. Hence the approximation is valid over all but the narrowest part of the membrane, where some errors may be introduced. The assumptions allow the problem to be rendered in two dimensions, with only fluid pressure and structure displacement as free variables. This process reduces the problem size, enabling a more refined solution in the x-y plane, where all of the geometric features of interest lie.
Eq. 1 models the fluid by using a modified 2D Helmholtz equation with viscous damping and structural coupling included. Viscosity enters by modifying the wave speed to a complex effective wavespeed, ceff. Note that all damping terms are controlled by the dimensionless parameter δ/h0, the ratio of the viscous boundary layer thickness to the duct height.
P is the acoustic pressure in the fluid, wp is the membrane displacement, h0 is the duct height, Tx and Ty are the membrane tensions in the x and y directions, respectively, ma is the membrane mass per unit area, ρ0 is the unperturbed fluid density, ω is the angular frequency, c0 is the acoustic free wave speed in the fluid, μ is the fluid viscosity, δ is the viscous boundary layer thickness, x, y, z are Cartesian coordinates, and j is the square root of -1.
 |
[1] |
where
 |
The structural equation used is the Helmholtz equation driven by the fluid pressure,
 |
[2] |
A standard Galerkin finite element procedure is used to solve the system. All geometric parameters are measured after processing. The duct height, h0, is 110 μm. The fluid density, ρ0, is 911 kg/m3 for the 5-cSt fluid and 950 kg/m3 for the 20-cSt fluid. The viscosity, μ, is either 5 or 20 cSt. The fluid wave speed and membrane mass per unit area have little impact on model predictions. They are taken to be c0 = 1,000 m/s, and ma = 2.0 g/m2 for the isotropic membrane, ma = 3.6 g/m2 for the orthotropic membrane. The two orthogonal tensions in the membrane are the most difficult parameters to determine. As discussed earlier, wafer curvature measurements and manufacturer data are used to estimate the tensions at Tx = Ty = 320 N/m for the isotropic case, and Tx = 30 N/m, Ty = 240 N/m for the orthotropic case. The model results used for comparison with experimental results (see Figs. 7 and 8) use the tensions computed from wafer curvature, with no additional tuning.
Fig. 7.
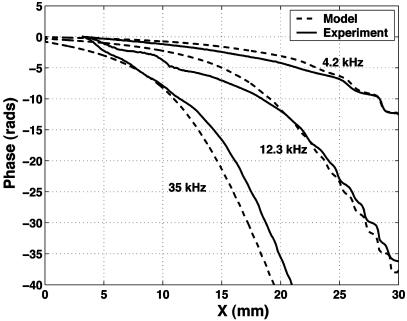
Comparison of phase results between model and experiment for an isotropic membrane with 5-cSt filling fluid.
Fig. 8.
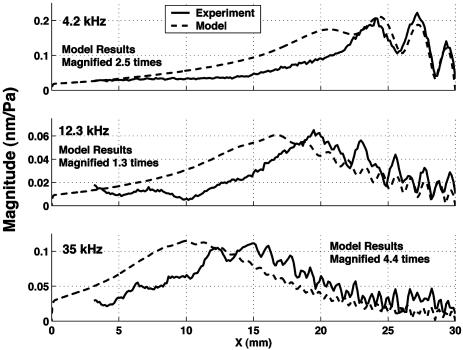
Comparison of magnitude results between model and experiment for an isotropic membrane with 5-cSt filling fluid. The magnitude of the model results is magnified by the given factors to allow comparison of the shape of the response.
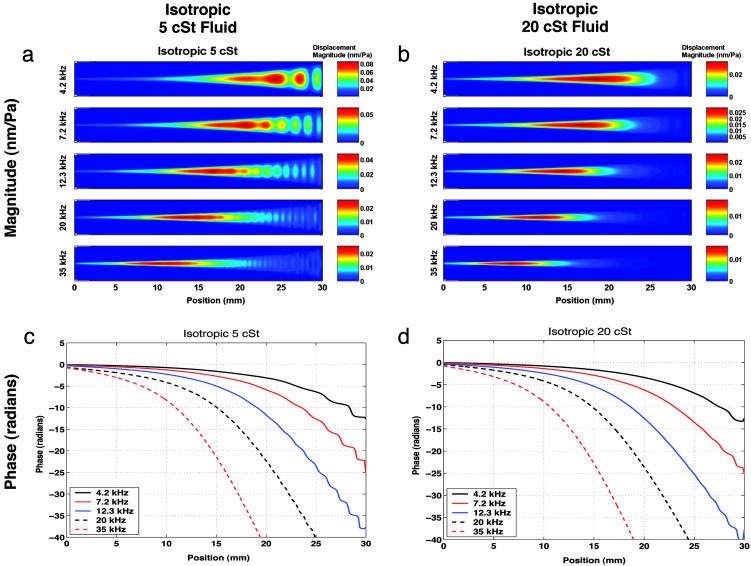
Fig. 6 gives model predictions for the two isotropic membrane cases. (The model results for the orthotropic membrane case are not shown because they are very similar, but are included in Fig. 10, which is published as supporting information on the PNAS web site.) These can be compared with the experimental results in Fig. 5. A frequency-position map is predicted with a 19-mm location for 4.2 kHz moving to 8 mm for 35 kHz. The predicted response is ≈0.02 nm/Pa for all cases where no standing waves are involved.
Fig. 6.
Computational results show magnitude and phase of membrane response at five excitation frequencies for isotropic membrane with 5-cSt fluid (a and c) and isotropic membrane with 20-cSt fluid (b and d). The model results for the orthotropic membranes (data not shown) are virtually indistinguishable from these results, but are included in Fig. 10.
For the 5-cSt case, standing waves are predicted at low frequencies close to x = 30 mm, which can be seen in both the magnitude and phase plots (Fig. 6 a and c). Increasing the viscosity to 20 cSt suppresses the standing waves, as seen in Fig. 6 b and d. The experimental results also show this effect. The antisymmetric cross-mode results seen in the experiments are not present in the model output, since the model uses a symmetry condition along the membrane centerline. Any asymmetries present in the experiment are unintentional, so including asymmetry in the model to generate asymmetric response would be completely ad hoc, and so has not been done.
A direct comparison of experimental results and model predictions for the phase are shown in Fig. 7. A phase lag of between 5 and 10 radians is predicted at the location of maximum response, commensurate with experimental results. Wave decay produced by viscous damping effects is also well captured, as seen in the comparison between the predicted and measured membrane displacement magnitude given in Fig. 8. The magnitude of the modeled and measured response, normalized to the driving pressure, is correct within our ability to resolve the driving pressure, given directionality of both the speaker and microphone.
Discussion
Both the physical and mathematical models demonstrate acoustically excited fluid-structure traveling waves that produce a passive cochlear-like frequency-position map in the 4- to 35-kHz band. At the location of maximum response, the phase accumulation is 1.5-3 π radians. This finding is similar to experimental data for guinea pigs, chinchillas, squirrel monkeys, and cats, which show average phase accumulations of 3 π at the best frequency for a given location (24).
An examination of both experimental and theoretical results, shown in Figs. 5 and 6, indicates that to suppress the formation of nonphysiological standing waves at low frequencies 20-cSt fluid is required. However, even with this introduction of additional passive damping, the rate of cutoff of the traveling wave is sharper in animal experiments than in our model. This finding suggests that additional effects present in the cochlea, such as correctly phased active excitation by the outer hair cells, produce the sharp filtering. The helicotrema, which connects the scala at the apex of the cochlea, is not included in our model and could also provide some of the needed damping for the lowest frequencies.
Another way to increase the sharpness and gain of the mechanical filter, in theory, is to increase the orthotropy ratio. In the limit, as is done in some mathematical cochlear models, longitudinal stiffness of the BM is entirely neglected (15, 20). However, in construction of a physical model, it has proved difficult to produce membrane orthotropy ratios beyond a ratio of 8:1 in tension [resulting in a ratio of 3:1 for the transverse to longitudinal space constants, as defined by Naidu and Mountain (17)]. Experimental and mathematical results presented here show little improvement in filtering with such an orthotropy ratio. The recent experimental results by Naidu and Mountain (17) indicate that physiologically the longitudinal stiffness of the BM, while lower than transverse stiffness, is not negligible. In fact, the space constants measured by Naidu and Mountain that characterize longitudinal coupling in the gerbil BM are similar to those computed for the structure presented in this article. Thus, use of very high orthotropy ratios to produce sharp filtering in a model appears to not be directly physical, but might be better considered a convenient way to represent some more complex phenomenon occurring in vivo. Possibilities include the active processes related to outer hair cell operation or additional passive mechanical tuning resulting from interactions of the BM with the tectorial membrane. See Geisler (ref. 10, pp. 125-138) and Dallos et al. (ref. 1, pp. 202-203) for discussion of these mechanisms.
Comparisons of the mathematical results with measured response, such as those shown in Figs. 7 and 8, demonstrate the accuracy of the thin film fluid model. Most significantly, the effects of viscous damping are captured correctly and efficiently. To produce a good match, it is critical that the rigid boundary conditions used in the mathematics are a good approximation.
A micromachined device such as that presented here offers a unique modality for acoustic sensing. A passive device would be capable of low-power acoustic sensing and mechanical filtering, delivering multiple channels of filtered information from sensors spatially distributed along the length of the device. Both passive and active systems are made practical through the use of micro-electro-mechanical systems technology. A microfabrication process for the mechanical subsystem has been demonstrated in this work. The next step is to incorporate sensing elements and active feedback mechanisms into the structure.
Supplementary Material
Acknowledgments
This work was supported by the Office of Naval Research and the National Science Foundation.
This paper was submitted directly (Track II) to the PNAS office.
Abbreviations: BM, basilar membrane; cSt, centiStokes.
References
- 1.Dallos, P., Popper, A. & Fay, R., eds. (1996) The Cochlea, Springer Handbook of Auditory Research (Springer, New York), Vol. 8.
- 2.von Békésy, G. (1970) Nature 225, 1207-1209. [DOI] [PubMed] [Google Scholar]
- 3.von Békésy, G. (1960) Experiments in Hearing (McGraw-Hill, New York).
- 4.Helle, R. (1977) J. Audiol. Technique 16, 138-163. [Google Scholar]
- 5.Chadwick, R. S., Fourney, M. E. & Neiswander, P. (1980) Hear. Res. 2, 475-483. [DOI] [PubMed] [Google Scholar]
- 6.Lechner, T. P. (1993) Hear. Res. 66, 202-212. [DOI] [PubMed] [Google Scholar]
- 7.Zhou, G., Bintz, L., Anderson, D. Z. & Bright, K. E. (1993) J. Acoust. Soc. Am. 93, 1516-1523. [DOI] [PubMed] [Google Scholar]
- 8.Hemmert, W., Durig, U., Despont, M., Drechsler, U., Genolet, G., Vettiger, P. & Freeman, D. M. (2002) in Biophysics of the Cochlea: From Molecules to Models, ed. Gummer, A. W. (World Scientific, Teaneck, NJ), pp. 409-416.
- 9.Lim, K.-M., Fitzgerald, A. M., Steele, C. R. & Puria, S. (1999) in Recent Developments in Auditory Mechanics, eds. Wada, H., Takasaka, T., Ikeda, K., Ohyama, K. & Koike, T. (World Scientific, Teaneck, NJ), pp. 223-229.
- 10.Geisler, C. D. (1998) From Sound to Synapse (Oxford Univ. Press, London).
- 11.Iurato, S. (1962) J. Acoust. Soc. Am. 34, 1386-1395. [Google Scholar]
- 12.Loh, C. H. (1984) J. Acoust. Soc. Am. 74, 95-103. [Google Scholar]
- 13.Steele, C. R. & Zais, J. G. (1985) J. Acoust. Soc. Am. 77, 1849-1852. [DOI] [PubMed] [Google Scholar]
- 14.Manoussaki, D. & Chadwick, R. S. (2000) SIAM J. Appl. Math. 61, 369-386. [Google Scholar]
- 15.Parthasarathi, A. A., Grosh, K. & Nuttall, A. L. (2000) J. Acoust. Soc. Am. 107, 474-485. [DOI] [PubMed] [Google Scholar]
- 16.Zwislocki, J. J. (1948) Acta Otolaryngol., Suppl., 72, 1-76. [Google Scholar]
- 17.Naidu, R. & Mountain, D. (2001) J. Assoc. Res. Otolaryngol. 2, 257-267. [DOI] [PMC free article] [PubMed] [Google Scholar]
- 18.Voldrich, L. (1978) Acta Otolaryngol. 86, 331-335. [DOI] [PubMed] [Google Scholar]
- 19.Steele, C. R. & Taber, L. A. (1979) J. Acoust. Soc. Am. 65, 1007-1018. [DOI] [PubMed] [Google Scholar]
- 20.de Boer, E. & Viergever, M. A. (1982) Hear. Res. 8, 131-155. [DOI] [PubMed] [Google Scholar]
- 21.Kolston, P. J. & Ashmore, J. F. (1996) J. Acoust. Soc. Am. 99, 455-467. [DOI] [PubMed] [Google Scholar]
- 22.Kagawa, Y., Yamabuchi, T., Watanabe, N. & Mizoguchi, T. (1987) J. Sound Vib. 119, 291-315. [Google Scholar]
- 23.Beltman, W. M., vanDerHoogt, P., Spiering, R. & Tijdeman, H. (1998) J. Sound Vib. 216, 159-185. [Google Scholar]
- 24.Robles, L. & Ruggero, M. A. (2001) Physiol. Rev. 81, 1305-1352. [DOI] [PMC free article] [PubMed] [Google Scholar]
Associated Data
This section collects any data citations, data availability statements, or supplementary materials included in this article.


