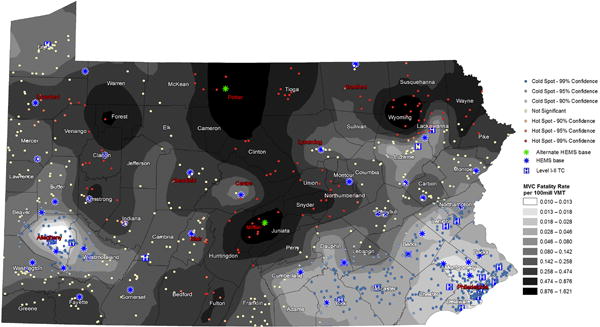
Figure 1.

Fatal motor vehicle collisions (MVC) in Pennsylvania 2013 to 2014. Gray scale color ramp represents fatal MVC rate per 100 million vehicle miles traveled from empiric Bayes kriging interpolation. Individual MVC event locations are represented by color dot corresponding to hotspot analysis. Red represents hot spots with spatially clustered high fatal MVC rates per 100 million VMT at the indicated confidence level. Blue represents cold spots with spatially clustered low fatal MVC rates per 100 million VMT at the indicated confidence level. Level I/II trauma center locations are represented by the blue hospital symbols. Helicopter emergency medical services (HEMS) base locations are represented by the blue stars. Proposed alternate HEMS base locations for evaluation of the potential impact of trauma system resource redistribution are represented by the green stars. Counties are labeled, red county names indicate counties referred to in the Results section.
