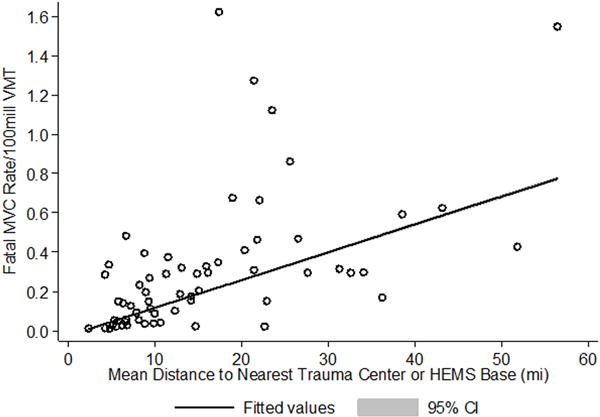
Figure 2.

Plot of fatal MVC rate per 100 million vehicle miles traveled by mean distance to the nearest trauma system resource. Each open circle represents a Pennsylvania county. Distance in miles represents mean of all fatal MVC events occurring within the county. Line represents fitted linear regression values with 95% confidence interval.
