
Figure 1.
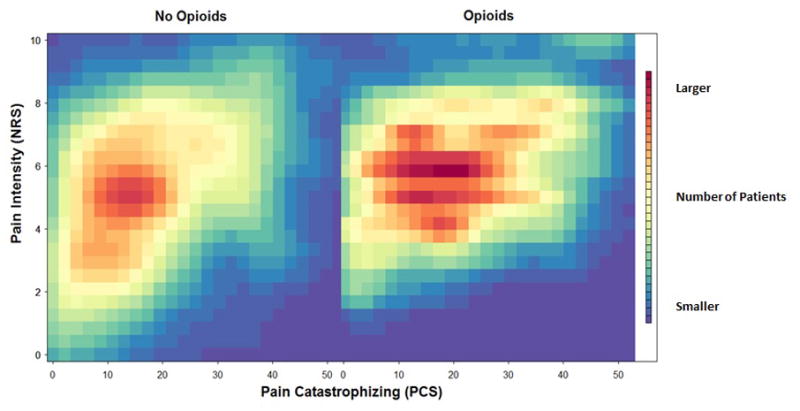
Heat map of distribution of patients in terms of pain catastrophizing and pain intensity, by opioid prescription status. The color red represents the greatest patient density.
Official websites use .gov
A
.gov website belongs to an official
government organization in the United States.
Secure .gov websites use HTTPS
A lock (
) or https:// means you've safely
connected to the .gov website. Share sensitive
information only on official, secure websites.
Heat map of distribution of patients in terms of pain catastrophizing and pain intensity, by opioid prescription status. The color red represents the greatest patient density.