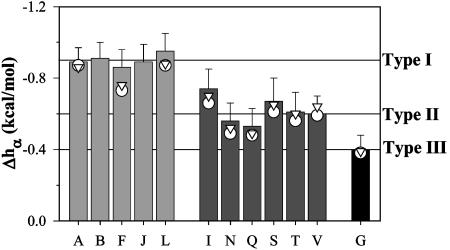
Fig. 6.
Comparison of the enthalpy of helix formation Δhα obtained from different peptides by using Eq. 3. Horizontal lines are drawn at -0.9 kcal/mol (type I), -0.6 kcal/mol (type II), and -0.4 kcal/mol (type III). For comparison, the values of Δhα calculated by using  (○) and
  (▵) computed by agadir (see Materials and Methods for details) are also shown.

