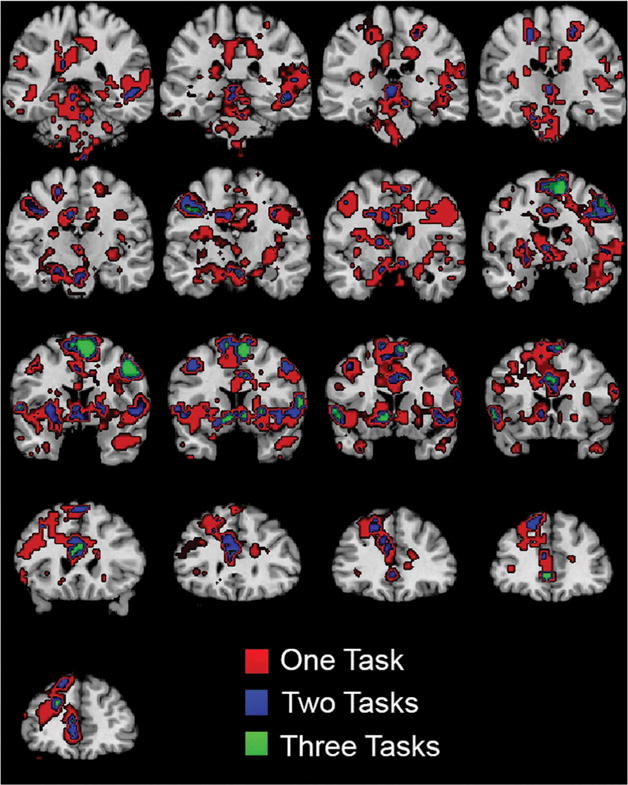
Figure 3.

Conjunction analysis shows activation associated with “feeling the Spirit” during all three tasks. Colors show significant activation during 1, 2, or 3 tasks, each thresholded at a t-statistic of 3.69, corresponding to a p-value < .001. Coronal images are shown with subject left on image left, with MNI slices ranging at 5-mm intervals from y = −40 to y = 40.
