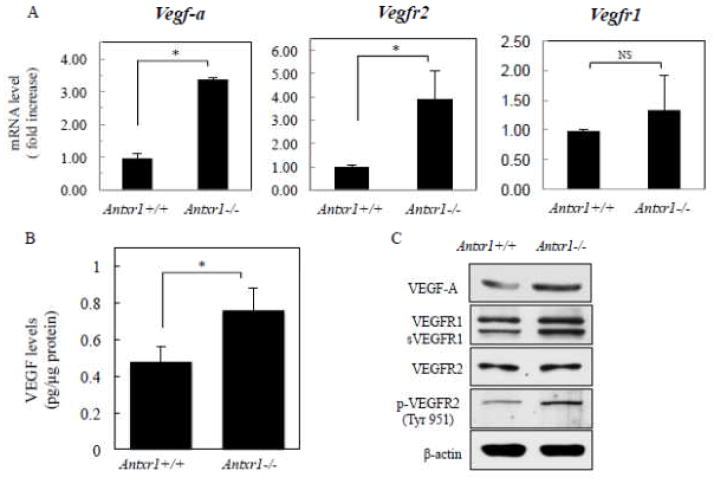
Fig. 2.
Mutant fibroblasts express high VEGF levels. (A) Bar graphs show average transcript levels (fold increase) in control and mutant fibroblasts isolated from P49 mice. (*P<0.05, n = 6 per group). (B) VEGF protein levels were assessed by ELISA (*P<0.05, n = 4 per group). (C) Immunoblotting of lysates from control and mutant fibroblasts of P49 mice.

