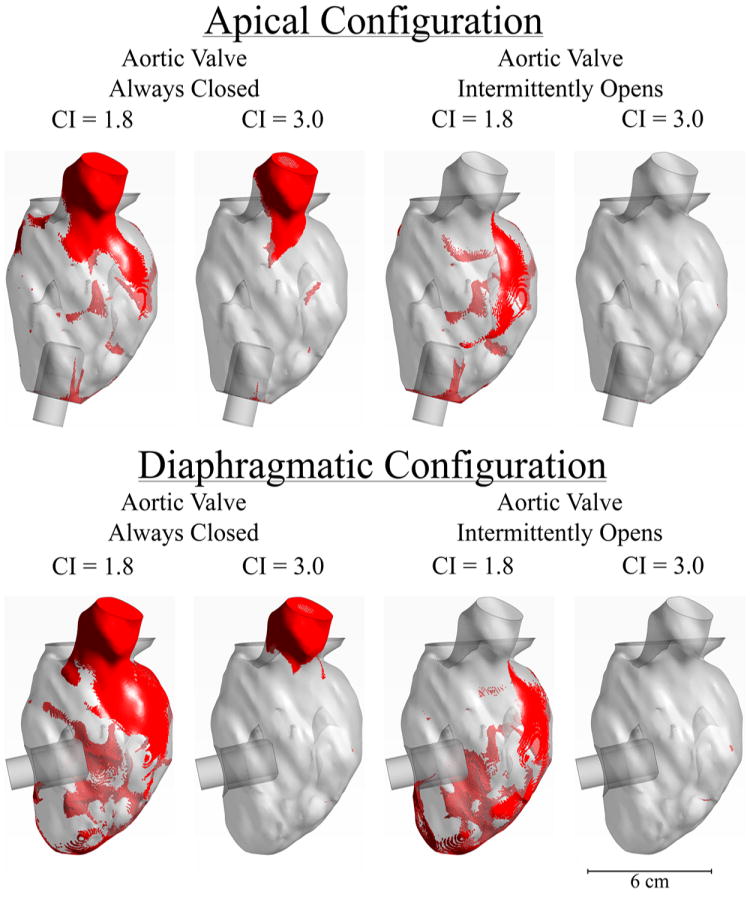
Figure 7. Visualization of Stagnation Zones.

After 12 seconds of simulation, the remaining red ink was visualized in each geometry. Elements were colored “red” if they contained more than 50% of the initial red ink concentration. Top figures are for the apical configuration, bottom figures are for the diaphragmatic configuration.
