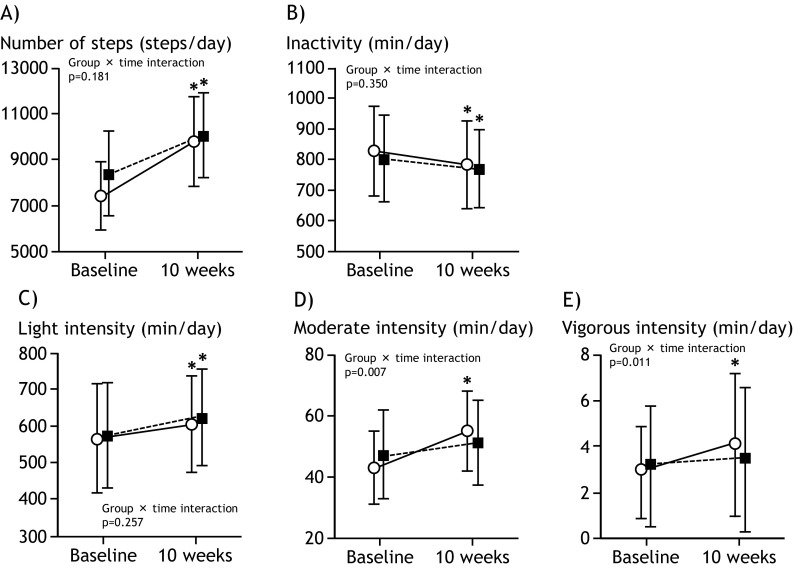
Fig. 3.
Comparisons of physical activity levels in the intervention and control groups at the baseline and after the 10-week intervention
Data are expressed as the mean ± standard deviation.
A) number of steps, B) inactive time, C) time spent in light intensity, D) time spent in moderate intensity, and E) time spent in vigorous intensity
Open circle; intervention group, filled square; control group
*; p for Wilcoxon signed-ranks test, <0.05, in comparison to values before intervention in each group.

