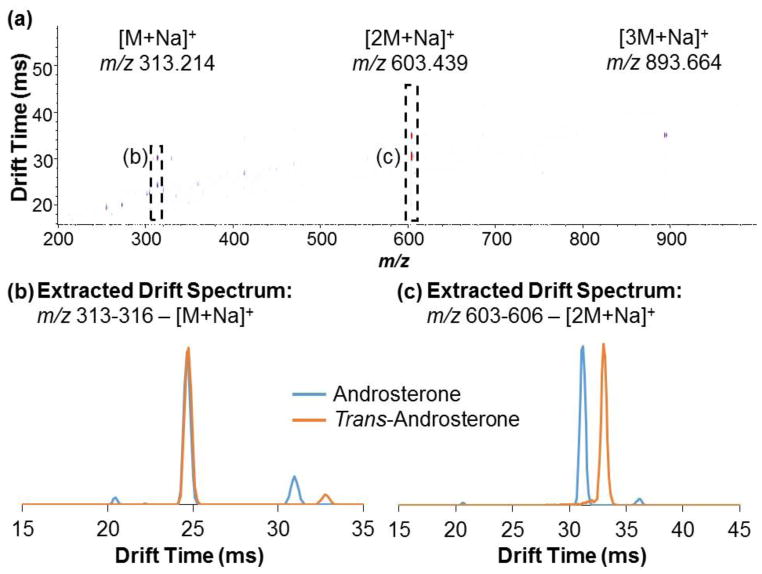
Fig. 1.
(a) IM-MS spectrum of androsterone, indicating sodiated species at m/z 313.214 for [M+Na]+, 603.439 for [2M+Na]+, and 893.664 for [3M+Na]+. Extracted drift spectra overlays for androsterone and trans-androsterone are shown for the (b) sodiated monomer range (m/z 313–316) and (c) sodiated dimer range (m/z 603–606)

