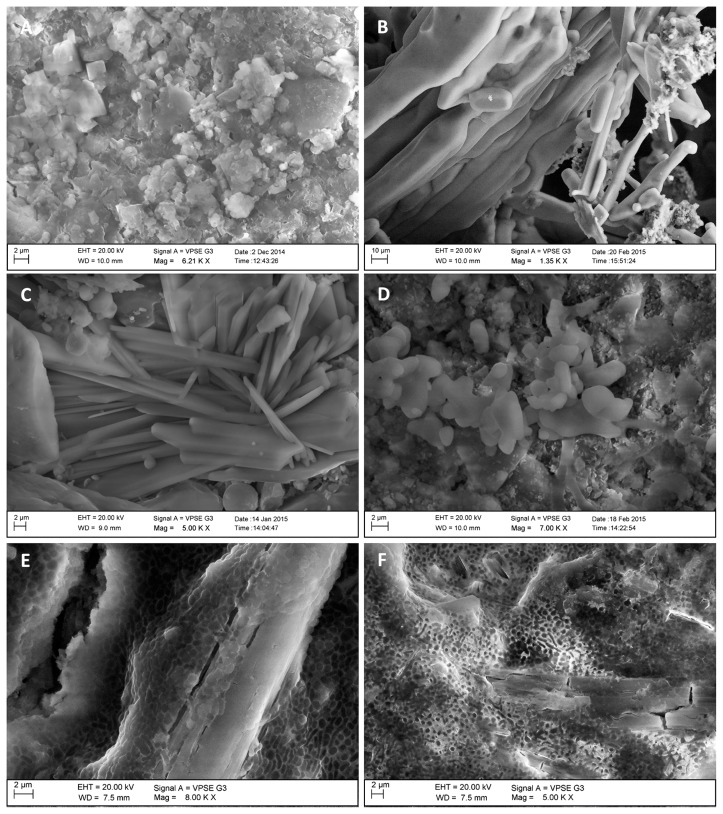
Fig. 3.
Crystals of sodium chloride on brick sample B3 (element content according to an EDS analysis: Chlorine 9.7–10.9, Sodium 7.2–12.5 wt%) (A); Crystals of sodium chloride on paint-coated plaster P4 (Chlorine 36.0–41.5, Sodium 29.0–32.4 wt%) (B); Crystals of calcium and potassium sulfates on brick sample B5 (Oxygen 39.4–53.4, Sulfur 10.8–14.8, Calcium 11.9–20.6, Potassium 2.5–11.4 wt%) (C); Crystals of sodium sulfate on plaster-coated paint sample P1 (Oxygen 41.8–45.1, Sulfur 7.3–7.5, Sodium 10.3–15.6 wt%) (D); Microorganism cells on sulfate crystals (E); Microorganisms cells on chloride crystals (F).

