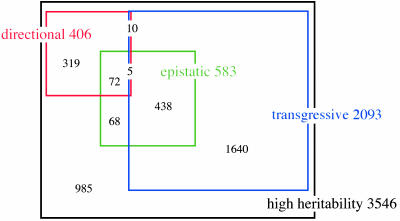
Fig. 3.
Prevalence of different inheritance patterns among highly heritable transcripts. The black rectangle represents all transcripts with high heritability. Colored squares and numbers represent the transcripts with high heritability that pass the indicated tests for inheritance patterns. Black numbers in overlapping squares represent transcripts that pass multiple tests; the black number at the lower left represents highly heritable transcripts that do not pass any of the tests.

