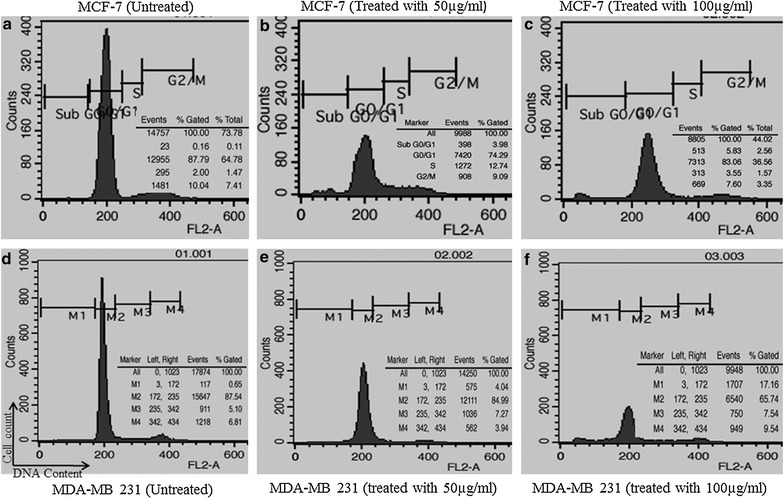
Fig. 3.

Representative histograms depicting cell cycle distribution in MDA-MB-231 and MCF-7 cultures following 48 h treatment with 50 and 100 µg/ml concentrations of BTB extract caused S and G2/M phase cell cycle arrest in MCF-7cells (b, c) and MDA-MB231 cells (e, f) with comparison to untreated control cells (a, d)
