

Abstract
This study aims to determine whether enzyme activities are correlated with protein amounts and mRNA expression levels of five major human sulfotransferase (SULT) enzymes in 10 matched pericarcinomatous and hepatocellular carcinoma liver samples. The MRM UHPLC-MS/MS method, Western blot and RT-PCR were used along with SULT activity measurement using probe substrates. The LC-MS/MS method was specific for all five tested SULTs, whereas Western blot was specific for only two isoforms. The activities of SULT1A1, SULT1B1, SULT1E1 and SULT2A1 in 9 of 10 samples showed a significant decrease in tumor tissues relative to matched pericarcinomatous tissues, whereas the activities of SULT1A3 in 7 of 10 samples increased. The turnover numbers of SULTs did not change, except for SULT1A1. A generally high degree of correlations was observed between SULT activities and protein amounts (r2 ≥ 0.59 except one), whereas a low degree of correlations was observed between SULT activities and mRNA expression levels (r2 ≤ 0.48 except one). HCC reduced the SULT activities via impaired protein amounts. LC-MS/MS quantification of SULTs is highly reliable measurement of SULT activities, and may be adopted for implementing precision medicine with respect to drugs mainly metabolized by SULTs in healthy and HCC patients.
Introduction
Precision medicine is a broad and rapidly advancing field in health care that considers the unique clinical, genetic, and environmental information of individuals1. Precision medicine was first practiced in oncology because of its potential to enhance targeted cancer therapies2. Precision medicine focuses on the following four significant aspects: human genetic information, transcription, protein and function/activity3, 4. Although defining genetic information and its transcription is quite common and easy, proteins and their activities should be determined to understand their biological in case of changes in their functions5. The latter may also enhance our understanding of the molecular pathogenesis of a disease6. Hence, proteins and their activities have the potential to serve as biomarkers associated with disease diagnosis, prognosis, stratification, and treatment7. Unfortunately, because of methodological shortcomings, protein amounts and activity are often not comprehensively evaluated, thereby hindering the implementation of precision medicine.
This scenario is particularly true for SULT enzymes, which catalyze sulfonation, a relatively understudied area in drug metabolism and clearance. In a typical human liver, four subfamilies of SULTs, namely, SULT1A, SULT1B, SULT1E, and SULT2A, are responsible for the metabolism of most marketed drugs8. SULT1A1 is generally recognized as the major xenobiotic-metabolizing SULT isoform that is responsible for the metabolism of reactive compounds (e.g., benzylic alcohols and aromatic hydroxylamines), which are associated with carcinogenesis9. Sulfate conjugation by other SULT enzymes (SULT1A3, SULT1E1 and SULT1B1) may result in the activation or inactivation of anti-cancer drugs (e.g., raloxifene, sesamol, fulvestrant, and resveratrol), thereby affecting their anti-tumor effects10–13. In addition, Huang LR et al.14 reported that SULT2A1 is involved in the phase II metabolism of dehydroepiandrosterone (DHEA) in vivo and the expression levels of dehydroepiandrosterone sulfotreansferase (DHEAS) are responsible for the difference in HCC. The expressions of SULT enzymes in tumors are crucial for cancer treatment because these proteins and enzymatic activities could be altered in the development of HCC15. Unfortunately, knowledge on the activities of SULT enzymes in HCC tumors remains limited. Moreover, only a few studies have directly assessed SULT protein expression and their functions, including specific enzyme kinetics and reaction rates in human tumor tissues. In comparison with phase I metabolism via important enzymes such as CYP3A4, SULTs do not always enjoy the abundance of reagents (e.g., lack of SULT isoform-specific and selective monoclonal antibodies or well characterized probe substrates) that are commonly associated with CYPs, the specific antibodies and substrates of which are often known and well characterized. In implementing precision medicine initiatives for SULT-mediated drug metabolism, the commonly used methods that will likely produce accurate results of enzyme activities must be identified. Identifying such methods is important because changes in key metabolism enzymes can lead to variability in the pharmacokinetic and pharmacodynamic properties of drugs (metabolized mainly by SULT enzymes) in patients and increase the possibility of therapeutic failure or severe toxicity. A comprehensive understanding of the influence of drug-metabolizing enzymes on drug disposition can assist the implementation of precision medicine16.
Currently, the established approach to explore SULT enzymes with respect to protein and mRNA expression levels in organs/tissues (S9) is focused on traditional bimolecular methods, such as Western blot and reverse-transcriptase polymerase chain reactions (RT-PCR)17. Western blot for SULTs lacks well-characterized SULT-specific and SULT-selective antibodies. Thus, its use is limited to semi-quantification, and it may fail to distinguish highly homologous proteins8. mRNA as the sole parameter to measure enzyme induction is prone to misinterpretation, which is often observed in overestimated induction potential18. Thus, traditional immunogenic methods do not meet the requirements of precision medicine.
MS-based quantifications are completely different from traditional immunogenic methods, such as Western blot analysis, which is generally restricted by the limited availability of specific antibodies. We can use the MRM UHPLC-MS/MS method to quantify the protein amounts of SULT enzymes. This method can improve the sensitivity (detecting peptides down to the femtomole range) and high throughput (simultaneously quantifying 50 or more proteins) of the absolute quantification of proteins, even those with high degrees of sequence homology (detecting peptides with varying molecular weights, which are less than 1 Da) in complex biologic matrices19, 20 or cultured cell lines21. Recently, we have developed an MRM UHPLC-MS/MS method to determine the absolute amounts of the isoforms of CYPs and UGTs in human liver tissues, and the results indicate the accuracy and reproducibility of this method and its potential to improve the understanding of hepatic disposition and drug metabolism22. In addition, this method can be used to distinguish different UGT1A isoforms, which are highly homologous proteins coded by a single gene with seven splicing variants.
In the present study, the activities, protein amounts and mRNA expression levels of the five major SULT enzymes were determined in 10 healthy liver samples, 10 HCC tumors and matched pericarcinomatous tissues. The differential expression of SULT enzymes in the tumor microenvironment was compared with those in pericarcinomatous tissues and healthy samples using the recently published LC-MS/MS method, which can simultaneously measure these SULT enzymes in one run even with a small sample size. Our data can demonstrate that LC-MS/MS effectively determines SULT enzymes levels and that it has the potential to aid the implementation of precision medicine in HCC patients who use drugs that are mainly metabolized by SULT enzymes.
Methods
Materials
Dopamine hydrochloride, 17β-estradiol 3-sulfate sodium salt, potassium 4-nitrophenyl sulfate, pregnenolone sulfate sodium salt, DHEA 3-sulfate sodium salt dehydrate, MgCl2, and 3′-phosphate 5′-phosphosulfate lithium salt hydrate (PAPS, >99% purity) were purchased from Sigma-Aldrich Co. (St. Louis, MO, USA). DHEA and 17β-estradiol were purchased from J&K Scientific LTD (Guangzhou, Guangdong, China). p-Nitrophenol and 2-aminophenol were obtained from Aladdin (Hang Zhou, Zhe Jiang, China). Dopamine 3-O-sulfate and dopamine 4-O-sulfate were purchased from TRC (Toronto, Ontario, Canada). The primary antibodies of SULT1A1, SULT1A3, SULT1B1, SULT1E1, and SULT2A1, as well as the GAPDH, were obtained from Santa Cruz Biotechnology (LA, California, USA) and Abcam (Cambridge, England, UK), respectively. TPCK (L-1-tosylamido-2-phenylethyl chloromethyl ketone)–treated trypsin was purchased from Promega (Madison, WI, USA). The recombinant human SULT isoforms (SULT1A1, SULT1A3, SULT1B1, SULT1E1 and SULT2A1) were purchased from R&D Systems (Toronto, Ontario, Canada). The solid phase extraction cartridges (C18 100 mg, 3 mL) were purchased from J.T. Baker (Philipsburg, NJ, USA). PrimeScript RT Reagent Kit and SYBR Premix Ex Taq II (TliRnaseH Plus) were purchased from Takara Bio (Shiga, Tokyo, Japan).
Human liver samples
All investigations of human subjects were reviewed and approved by the NanFang Hospital of Southern Medical University Research Ethics Committee, Guangzhou, China. All experiments were carried out in accordance with the approved guidelines and regulations (Declaration of Helsinki). Informed consent for the use of all HCC patients for the experiments was obtained from all subjects. All the subjects had undergone anatomic or limited hepatectomy for HCC resection at the Affiliated NanFang Hospital of Southern Medical University. The HCC tissues and matched pericarcinomatous tissues (tissues that were macroscopically dissected from the tumor and were 1 cm away from tumor lesions) were obtained from 10 Chinese subjects (33–71 years old; 52 ± 11 years old, mean ± SD); the details are shown in Table 1. The surgical specimens were confirmed via pathologic examination and clinical pathological parameters. The HCC tissues were classified into five grades (grades cannot be assessed, are well-differentiated, are moderately differentiated, are poorly differentiated, and are undifferentiated) according to the AJCC Cancer Staging Manual23. Only the moderately and poorly differentiated cases were selected in the present study. The HCC and pericarcinomatous tissues were kept in ice-cold saline immediately after resection and then used in the preparation of liver S9 immediately within 30 min or stored in liquid nitrogen before RNA extraction.
Table 1.
Human liver donor details and tissue histology.
| HCC patients | Gender | Age(years) | Ethnicity | Histology and Histological Gradea | AFP (μg/L)b | Volumec (cm3) | Healthy tissues | Genderd | Age (years) | Ethnicity |
|---|---|---|---|---|---|---|---|---|---|---|
| B03022 | Male | 59 | Asian | HCC(M) | >1000 | 364.8 | 1 | M | 60 | Caucasian |
| B03281 | Male | 58 | Asian | HCC(M) | >1000 | 139.7 | 2 | M | 56 | Caucasian |
| B04051 | Male | 39 | Asian | HCC(M) | 2.9 | 253.1 | 3 | M | 34 | Caucasian |
| B05171 | Male | 71 | Asian | HCC(P) | >1000 | 129.1 | 4 | M | 55 | Caucasian |
| C07101 | Male | 42 | Asian | HCC(P) | 4834 | 499.4 | 5 | M | 44 | Caucasian |
| C11051 | Male | 33 | Asian | HCC(M) | 3967 | 66.8 | 6 | F | 66 | Caucasian |
| D01151 | Male | 53 | Asian | HCC(M) | 777 | 683.2 | 7 | F | 49 | Caucasian |
| D05151 | Male | 53 | Asian | HCC(M) | >1000 | 140.9 | 8 | F | 52 | Caucasian |
| D10311 | Male | 56 | Asian | HCC(M) | N/A | N/A | 9 | F | 29 | Caucasian |
| D12241 | Male | 51 | Asian | HCC(M) | N/A | N/A | 10 | F | 54 | Caucasian |
aHCC, Hepatocellular carcinoma; M, Moderately differentiated; P, Poorly differentiated.
bAFP, Alpha-fetoprotein.
cTumor volume was determined by two-dimensional Volume (cm3) using the formula: length * width2/2, length and width of tumor were diagnosed by US or CT.
dM: male F: female.
Preparation of human liver S9
The liver S9 fractions of the 10 HCC patients were processed with the protocol used previously with some minor modifications21. After washing with ice-cold buffer (8 mM KH2PO4, 5.6 mM Na2HPO4, 1.5 mM EDTA, 1 mM DTT, and 0.28 mM phenylmethylsulfoyl fluoride), the tissues were minced and homogenized in a solution containing 50 mM phosphate buffer (containing 250 mM sucrose and 1 mM EDTA, pH 7.4) and subsequently centrifuged at 9000 × g for 20 min at 4 °C. The obtained supernatant contained the S9 fractions and it was immediately stored at −80 °C24. The total protein concentration was measured using the Bradford method, with bovine serum albumin as the standard25. A set of healthy human liver S9 fractions (hHLS9-individual), which were prepared from 10 healthy livers without chronic diseases, was also obtained from BD Biosciences (Worburn, MA) according to similar procedures. The donor details and tissue histology are shown in Table 1.
Total RNA extraction
The total RNA of the liver tissues was isolated and purified using a PureLink RNA Mini Kit purchased from Ambion, Life Technologies (Waltham, MA, USA) according to the manufacturer’s instructions. The concentration and purity of the total RNA were assessed using a Biospec-nano spectrophotometer (Shimadzu, Shiga, Tokyo, Japan). RNA quality was determined on the basis of A260/A280 ratio, which was 1.7 to 2.0 for all RNA preparations26.
Absolute quantification of SULT enzymes in human liver S9 by using the MRM UHPLC-MS/MS method
The procedure is aimed at the selection of unique peptides for the MRM UHPLC-MS/MS method (Supplementary Fig. S1). We established the method for the absolute quantification of the SULT enzymes including SULT1A1, SULT1A3, SULT1B1, SULT1E1 and SULT2A1 in human SULT recombinant proteins, healthy human liver S9 samples (hHLS9-individual), HCC tumors (tHLS9-individual), and matched pericarcinomatous tissues (nHLS9-individual). The details of these methods were shown Supplementary Fig. S1 and Tables S1 and S2. The absolute expression amount of SULT1A1 was calculated indirectly by subtracting the SULT1A2 amount from the total amount of SULT1A1/1A2. A universal internal standard peptide (GYLPNPALQR) was designed for the quantification of these proteins. All the signature peptides were synthesized by APeptide Co. Ltd. (Shanghai, China), and their purity (>95%) was determined using HPLC-UV (with a detection wavelength of 220 nm) analysis and ESI-TOF-MS analysis. The stock solutions of all signature peptides were prepared in acetonitrile–water–formic acid (5: 95: 0.1, v/v/v).
The protein amounts of the five SULT enzymes were determined simultaneously through the MRM UHPLC-MS/MS method described previously, with some minor modifications21. The protein amounts were determined by quantifying proteotypic peptides produced through trypsin digestion22, using synthetic standard peptides (APeptode Co, Shanghai, China). All samples were analyzed using Agilent 1290 series UHPLC system and an Agilent 6490 Triple Quadruple mass spectrometer equipped with an electrospray ionization (ESI) source (Agilent Technologies). The LC column used for peptide separation was prepared using a Poroshell C18 column (2.1 mm × 100 mm, 2.7 μm) (Agilent Technologies) at 40 °C with a thermostated column oven. The mobile phase was composed of 0.1% formic acid water (A) and acetonitrile (B) using a gradient elution of 5–5% (v/v) B at 0–10 min, 5–45% B at 10–11 min, 45–80% B at 11–12 min, 80–5% B at 12–13 min. The flow-rate was 0.3 mL/min, and the injection volume was 5 μL. Quantification was performed in positive ion mode, and the mass spectrometer was configured to run a dynamic MRM experiment for peptides. The instrument settings were as follows: capillary voltage 3000 V; nebulizer gas, 30 psi; gas temperature, 15 °C; and sheath gas flow, 11 L/min. The MRM transitions are listed in Supplementary Table S2 and Supplementary Fig. S2. Generally, at least three MRM transitions are selected for protein quantification to obtain high sensitivity and high selectivity22. High sensitivity is achieved through quantitative ions. Selectivity is acquired by qualitative ions. Initially, we used the peptide standard to develop and optimize the MS method. After optimization, the highest response of two transitions was recorded for subsequent protein quantification. The reason is that in the process of tryptic digestion, the existence of matrix interference can affect quantitative ions in different degrees. Therefore, matrix interference may lead to the response of MRM pairs in peptide standard solutions and digested samples of liver tissues. Hence, we always selected the MRM pairs with the highest response in liver samples to detect protein amounts, which led to mostly y-ions, except for SULT1A3, in which the b-ions were better (Supplementary Fig. S3).
Calibration curves were established by plotting the peak area ratios of each selected MRM versus the concentrations of signature peptides that spiked. A weighting factor 1/x was applied. All calibration curves were required to have a correlation value of at least 0.99 (Supplementary Fig. S4).
Western blot analyses
The healthy human liver S9 samples and the recombinant human SULT proteins were analyzed by using Western blot. The protein samples were loaded onto each lane and separated by SDS-PAGE (4% stacking gel, 10% separating gel). GAPDH served as the loading control. The procedures were performed according to the literature27.
Measurement of SULT enzymatic activities in healthy, tumor and pericarcinomatous tissues
SULT1A1, SULT1A3, SULT1B1, SULT1E1, and SULT2A1 activities were measured using probe substrates. The sulfonation processes were observed in tHLS9-pooled and nHLS9-pooled collected from 10 HCC patients, and rHLS9-pooled was used as the reference. The assay details are provided in Supplementary Table S3. Assay conditions, such as protein concentration and incubation time, were validated to derive the linear enzyme kinetics. In general, a typical incubation mixture (final volume = 200 μL) containing 50 mM potassium phosphate buffer at pH 7.4 is used. Liver S9 (final concentration = 0.25 mg/mL) for measuring the activities of every probe substrate, except SULT1A3 (with a concentration of 0.5 mg/mL), was mixed with MgCl2 (1 mM) and PAPS (0.025 mM) prior to the addition of the substrates at varying concentrations (details are presented in Supplementary Table S4). The formation of metabolites of p-nitrophenol (SULT1A1), dopamine (SULT1A3), 2-aminophenol (SULT1B1), 17β-estradiol (SULT1E1), and DHEA (SULT2A1) were monitored using an Agilent 1290 Infinite UHPLC system coupled with Agilent G6490 triple quadruple mass spectrometer equipped with an ESI source in negative ionization mode. All the analytical methods were validated. The optimal instrument-dependent and compound-dependent parameters for measuring various SULT metabolites are summarized in Supplementary Table S4. MassHunter Acquisition Software Rev B6.00 (Agilent Technologies) was used for data acquisition.
Real-time PCR Gene Expression Analysis
The full-length sequences of the target genes were obtained from GeneBank, and the primers (forward and reverse) were designed using Primer Premier 6.0 (Premier Biosoft, CA) software and according to the criteria described previously28. The uniqueness of the primer sequences was assessed by performing a BLAST search (National Center for Biotechnology Information). The details of the primers and inventory used in the present study are provided in Supplementary Table S5. All the oligonucleotide primers were custom-synthesized by BGI Technologies. (Shenzhen, China).
For first-strand cDNA synthesis, 1,600 ng of total RNA was reverse-transcribed to a final volume of 40 μL following the protocol for the PrimeScriptTM RT Reagent Kit. The reactions were diluted with water 20 times in all real-time PCR experiments. Real-time PCR was performed in an ABI 7500 Fast Real-Time PCR System (Applied Biosystems) using SYPR Premix Ex TaqTM II. The PCR amplification had 40 cycles (95 °C for 5 s and 60 °C for 34 s) after an initial denaturation step (95 °C for 30 s). All measurements were performed in triplicate. The relative expression differences were calculated using the comparative ΔΔCt method29, and Ct values were normalized to GAPDH expression levels.
Statistical analysis
The Shapiro–Wilk test of normality was performed in SPSS Statistics 17.0 software to check the distribution shape of the data. A paired-sample t-test was performed to analyze the normally distributed data. For non-normally distributed data, a Wilcoxon sign rank test was used. Correlation analyses were performed using a Pearson product-moment correlation for normally distributed data and Spearman rank correlation for non-normally distributed data. A P value of <0.05 was considered as the minimum level of statistical significance (two-tailed) for all the statistical analyses. The kinetic parameters were estimated to fit the proper models (Michaelis–Menten, autoactivation, substrate inhibition or biphasic kinetic) to the substrate concentrations and initial rates using GraphPad Prism 5.0 software, aided by profiles of the EadieHofstee plots as previously described30.
The calculation of the absolute amount of proteins used for MRM UHPLC-MS/MS was described previously22 and used with some minor modifications. The protein amounts of SULT enzymes can be calculated as follows:
| 1 |
where ASULT (pmol/mg S9 protein) denontes the protein amounts of SULT enzymes in the human liver S9, Cpeptide (pmol/μL) is the peptide concentration, and V is the complex volume (200 μL) before the UHPLC-MS/MS analysis; the amount of total S9 protein is 0.1 mg.
The turnover number (TON) indicates the catalytic capacity of enzymes. It is defined as the amount of substrate molecules that can be converted by an enzyme protein into a product per unit of time (a turnover rate). The TON can be calculated as follows:
| 2 |
where V is the reaction rate at a specific substrate concentration, and Et is the total enzyme concentration. As the protein amount of each SULT enzyme was quantified in hHLS9-individual, tHLS9-individual, and nHLS9-individual through the LC/MS-MS method, the TONs of the probe substrates metabolized by the SULT enzymes in the healthy, pericarcinomatous, and tumor tissues were obtained.
Results
Comparison between Western blot, and the MRM UHPLC-MS/MS method with regard to analysis specificity and speed of analysis
To validate the specificity of the analysis method, we used the Western blot analysis and MRM UHPLC-MS/MS methods in analyzing human recombinant SULT proteins, namely, SULT1A1, SULT1A3, SULT1B1, SULT1E1 and SULT2A1. As shown in Fig. 1(a), only 40% of the antibodies displayed specificities. As shown in Fig. 1(b), 100% of the MRM UHPLC-MS/MS displayed absolute specificity. The Western blot analysis took 24 h, whereas the MRM UHPLC-MS/MS method finished the analysis in less than 10 min, although sample preparation took about 6 h31, 32.
Figure 1.
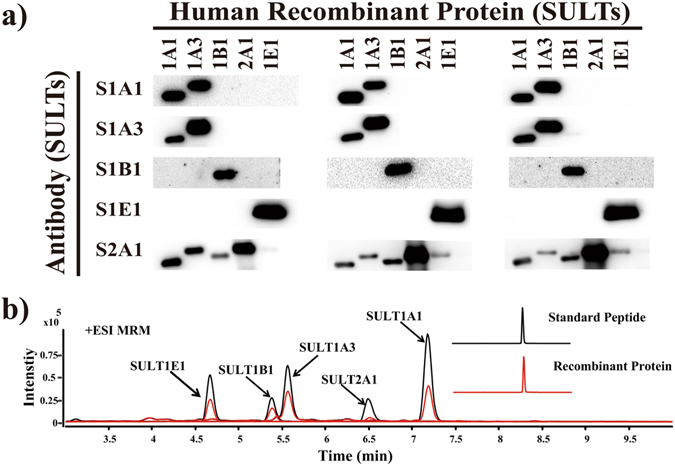
(a) SULT enzyme antibodies were used to analyze human recombinant proteins including SULT1A1, SULT1A3, SULT1B1, SULT1E1 and SULT2A1. The same experiments were repeated three times. (b) The black peak represents the MRM chromatograms of the tryptic peptides derived from healthy human liver S9 samples, and the chromatograms of the five tryptic peptides were detected through quantitative MRM transitions. The red peak represents the MRM chromatograms of SULT human recombinant proteins.
SULT enzyme protein quantification and correlation plots in 10 healthy human liver S9 samples
We used MRM UHPLC-MS/MS to quantify five SULT enzymes, namely, SULT1A1, SULT1A3, SULT1B1, SULT1E1, and SULT2A1, in 10 healthy human liver S9 samples (Fig. 2(a1) and Supplementary Table S6). The protein amounts of SULT2A1 and SULT1A1 were 63.6 and 23.7 pmol/mg, respectively; these amounts appeared to be much higher than those of the other three enzymes. The protein levels of these five SULT enzymes were also determined using Western blot (Supplementary Fig. S3). As shown in Fig. 2(a2) and Supplementary Table S6, the Western blot analysis revealed relatively small differences among the five SULT isoforms. We then plotted the absolute protein amounts (from LC-MS/MS) and relative protein expression levels (from Western blot) (Fig. 2(b) and see Supplementary Table S6). As expected, the plots of SULT1B1 and SULT1E1 showed excellent correlation coefficients because the antibodies were specific. By contrast, SULT1A3 and SULT2A1 showed poor correlation because the antibodies displayed poor specificities (r2 = 0.492, r2 = 0.546). SULT1A1, which was expressed at significantly high levels in our LC-MS/MS measurement, displayed good correlation because its expression levels were much higher than those of the interfering SULT1A3 in human liver S9 (Supplementary Fig. S3), thereby suppressing the impact of SULT1A3 interference. The present LC-MS/MS method was validated in terms of intra- and inter-day precision and accuracy, recovery, and matrix effect (Supplementary Tables S7, S8 and S9).
Figure 2.
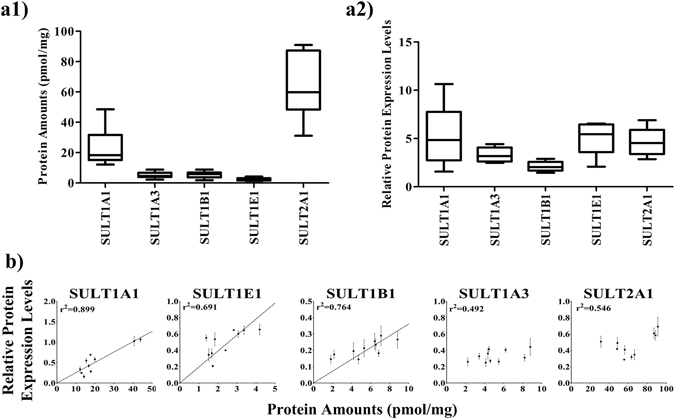
(a1,a2) Boxplots show the average protein amounts and relative protein expression levels of SULT1A1, SULT1A3, SULT1B1, SULT1E1, and SULT2A1 in the liver S9 samples from 10 healthy human donors, as determined by the MRM UHPLC-MS/MS method and Western blot analysis. (b) Correlation between the protein amounts and relative protein expression levels of SULT enzymes in hHLS9-individual. (SULT1A1, r2 = 0.899; SULT1B1, r2 = 0.764; SULT1E1, r2 = 0.691; SULT1A3, r2 = 0.492; SULT2A1, r2 = 0.546).
Change in kinetics profiles of SULT enzymes in tumor tissues of HCC patients
The metabolic activities and catalytic functions of SULT enzymes in HCC are rarely addressed in China. Thus, using probe substrates, we systematically measured the metabolic functions of SULT1A1, SULT1A3, SULT1B1, SULT1E1, and SULT2A1 in tumor S9 (tHLS9-pooled), pericarcinomatous S9 (nHLS9-pooled), and reference pooled normal human S9 (rHLS9-pooled). As a rare exception, the apparent kinetic mechanism was the same for all the pooled samples, except for SULT2A1, in which rHLS9-pooled displayed a mechanism (Michaelis–Menten) different from those of the other two types of S9 (substrate inhibition) (Table 2).
Table 2.
Summarize of enzyme kinetic parameters for five SULT activities in pooled human Liver S9.
| Isoforms | Kinetic Parameters | nHLS9s-pooled | tHLS9s-pooled | rHLS9-pooled |
|---|---|---|---|---|
| SULT1A1a | Km (μM) | 0.88 ± 0.20 | 0.82 ± 0.06 | 2.63 ± 0.16 |
| Vmax (pmol/mg/min) | 2004.77 ± 102.28 | 451.31 ± 6.88 | 3679.89 ± 67.25 | |
| 4-Nitrophenyl sulfate | CL (Vmax/Km, μl/mg/min) | 2285.46 | 550.15 | 1400.78 |
| Kinetic mechanism | M-Mb | M-Mb | M-Mb | |
| SULT1A3 | Km (μM) | 0.17 ± 0.06 | 0.83 ± 0.22 | 0.41 ± 0.09 |
| Vmax (pmol/mg/min) | 35.27 ± 2.52 | 101.66 ± 10.07 | 38.67 ± 2.32 | |
| Dopamine 3-o-sulfate#1 | CL (Vmax/Km, μl/mg/min) | 201.77 | 122.12 | 95.15 |
| Kinetic mechanism | Substrate inhibition | Substrate inhibition | Substrate inhibition | |
| Km (μM) | 0.53 ± 0.18 | 0.95 ± 0.14 | 0.76 ± 0.19 | |
| Vmax (pmol/mg/min) | 6.53 ± 0.88 | 17.88 ± 0.97 | 6.66 ± 0.56 | |
| Dopamine 4-o-sulfate#2 | CL (Vmax/Km, μl/mg/min) | 12.29 | 18.88 | 8.75 |
| Kinetic mechanism | Substrate inhibition | Substrate inhibition | Substrate inhibition | |
| SULT1B1 | Km (μM) | 2.78 ± 0.19 | 2.38 ± 0.36 | 13.18 ± 2.50 |
| Vmax (pmol/mg/min) | 14.07 ± 0.22 | 6.12 ± 0.21 | 14.38 ± 1.20 | |
| Aminphenol-sulfate | CL (Vmax/Km, μl/mg/min) | 5.07 | 2.57 | 1.09 |
| Kinetic mechanism | M-Mb | M-Mb | M-Mb | |
| SULT1E1 | Km (μM) | 10.85 ± 1.20 | 9.33 ± 0.92 | 8.11 ± 1.63 |
| Vmax (pmol/mg/min) | 76.52 ± 3.56 | 30.21 ± 1.19 | 44.69 ± 5.30 | |
| β-Estradiol 3-sulfate | CL (Vmax/Km, μl/mg/min) | 7.05 | 3.24 | 5.51 |
| Kinetic mechanism | Biphasic | Biphasic | Biphasic | |
| SULT2A1 | Km (μM) | 0.73 ± 0.15 | 0.70 ± 0.12 | 0.81 ± 0.08 |
| Vmax (pmol/mg/min) | 95.14 ± 7.68 | 45.46 ± 3.44 | 81.98 ± 1.65 | |
| DHEA 3-sulfate | CL (Vmax/Km, μl/mg/min) | 129.57 | 64.56 | 101.26 |
| Kinetic mechanism | Substrate inhibition | Substrate inhibition | M-Mb |
aProbe substrate and its metabolite.
bM-M, Michaelis-Menten.
The isomers #1(Dopamine 3-o-sulfate) and #2(Dopamine 4-o-sulfate) are the two sulfation metabolites.
The Vmax values derived using different pooled S9 preparations were highly variable when using different probe substrates. As shown in Fig. 3 and Table 2, in terms of SULT1A1 activities, the Vmax value of nHLS9-pooled was smaller than those of rHLS9-pooled (Vmax: 2004.77 ± 102.28 pmol/mg/min vs. 3679.89 ± 67.25 pmol/mg/min); both Vmax values were much higher than that of tHLS9-pooled (451.3 ± 6.88 pmol/mg/min). In terms of SULT1A3, the Vmax values of nHLS9-pooled were the same as those of rHLS9-pooled (Vmax: 35.27 ± 2.52 pmol/mg/min vs. 38.67 ± 2.32 pmol/mg/min); both values were much lower than those of tHLS9-pooled (101.7 ± 10.1 pmol/mg/min). In terms of SULT1B1, the Vmax values of nHLS9-pooled were the same as those of rHLS9-pooled (Vmax: 14.07 ± 0.22 pmol/mg/min vs. 14.38 ± 1.20 pmol/mg/min); both values were higher than those of tHLS9-pooled (6.128 ± 0.21 pmol/mg/min). In terms of SULT1E1, the Vmax values of nHLS9-pooled were higher than those of rHLS9-pooled (Vmax: 76.52 ± 3.56 pmol/mg/min vs. 44.69 ± 5.30 pmol/mg/min), both values were higher than those of tHLS9-pooled (30.21 ± 1.19 pmol/mg/min).In terms of SULT2A1, the Vmax values of nHLS9-pooled were comparable to those of rHLS9-pooled (Vmax: 95.14 ± 7.68 pmol/mg/min vs. 81.98 ± 1.65 pmol/mg/min); both values were higher than those of tHLS9-pooled (45.46 ± 3.44 pmol/mg/min) (Table 2).
Figure 3.
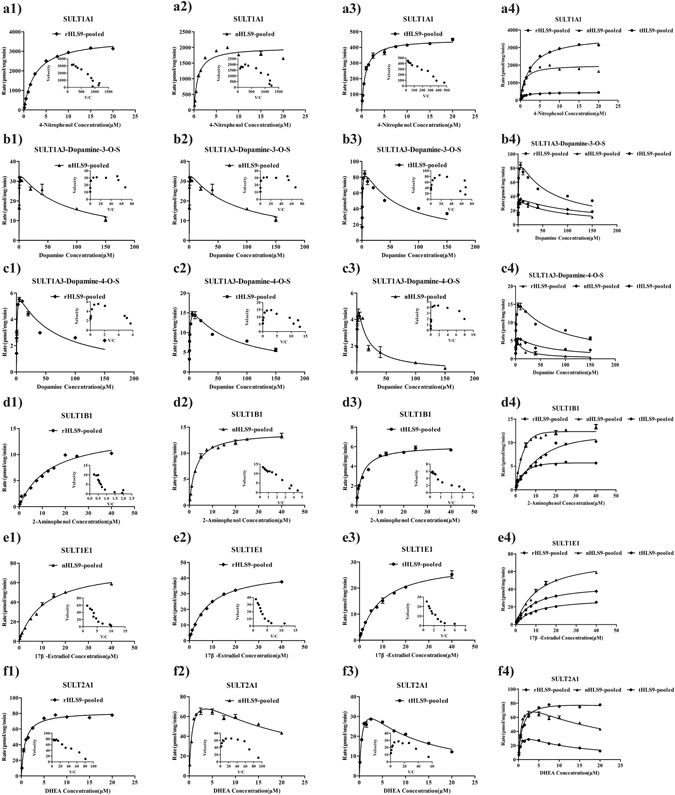
Enzyme kinetic analysis for the measurement of the activities of the five SULTs in rHLS9-pooled ((a1–f1), diamonds), nHLS9-pooled ((a2–f2), triangles), and tHLS9-pooled ((a3–f3), circles) through specific probe substrates. In each figure, the inset shows the Eadie-Hofstee plot. (a4–f4) show the comparison among the activities of the SULT isoforms in rHLS9-, nHLS9-, and tHLS9-pooled. Each data point represents an average of three determinations, and the error bar represents the SD of the mean (n = 3).
Intrinsic clearance values (Vmax/Km) is sometimes useful in determining in vivo clearance. Hence, a short summary of the differences in trend was made and presented. For SULT1A1, the trend was nHLS9-pooled > rHLS9-pooled > tHLS9-pooled (≈4:3:1). For SULT1A3, the trend was nHLS9-pooled > tHLS9-pooled > rHLS9-pooled (≈2:1:1). For SULT1B1, the trend was nHLS9-pooled > tHLS9-pooled > rHLS9-pooled (≈5:2:1). For SULT1E1, the trend was nHLS9-pooled > tHLS9-pooled > rHLS9-pooled (≈7:5:3). For SULT2A1, the trend was nHLS9-pooled > rHLS9-pooled > tHLS9-pooled (≈2:2:1).
For Km values, we also observed large differences in certain samples but not in others. However, we will not include the details here about their variability. Interested readers could refer to the values in Table 2.
Decrease in SULT enzymatic activities in tumor tissues of HCC patients
We used the probe substrates at predetermined low concentrations (one concentration for each SULT: 1 μM p-nitrophenol for SULT1A1, 0.625 μM dopamine for SULT1A3, 2.5 μM 2-aminophenol for SULT1B1, 10 μM 17β-estradiol for SULT1E1 and 1 μM DHEA for SULT2A1) to measure SULT enzymatic activities in the hHLS9-individual, nHLS9-individual, and tHLS9-individual (Table 3). As shown in Fig. 4, for SULT1A1, the activities in pericarcinomatous S9 were all higher than those in tumor S9; for SULT1B1, 20% were higher in pericarcinomatous S9 than in tumor S9, 70% were lower in pericarcinomatous S9 than in tumor S9, and 10% were left unchanged in HCC patients; for SULT1A3, 30% were higher in pericarcinomatous S9 than in tumor S9, and 70% were lower in pericarcinomatous S9 than in tumor S9; for SULT1E1, 50% were higher in pericarcinomatous S9 than in tumor S9, 40% were lower in pericarcinomatous S9 than in tumor S9, and 10% were left unchanged; for SULT2A1, 80% were higher in pericarcinomatous S9 than in tumor S9, 10% were lower in pericarcinomatous S9 than in tumor S9, and 10% were left unchanged.
Table 3.
SULTs Activities and Expression differences in Pericarcinomatous, Tumor and Healthy tissues.
| Enzyme | No. of Quantified Donor | Probe Substrate Activities | Protein Amounts | mRNA Expression Levels | ||||||||||||
|---|---|---|---|---|---|---|---|---|---|---|---|---|---|---|---|---|
| Mean | SD | Max | Min | Fold | Mean | SD | Max | Min | Fold | Mean | SD | Max | Min | Fold | ||
| Pericarcinomatous Tissues | pmol/mg/min | pmol/mg protein | relative gene expression rate | |||||||||||||
| #SULT1A1 | 10 | 63.7 | 50.9 | 155.2 | 12.0 | 12.9 | 13.2 | 10.3 | 33.6 | 2.8 | 12 | 0.9 | 0.2 | 1.0 | 0.6 | 1.6 |
| #SULT1A3a | 10 | 11.6 | 8.4 | 28.6 | 0.6 | 47.7 | 8.2 | 2.3 | 11.2 | 2.8 | 4 | 1.0 | 0.0 | 1.1 | 1.0 | 1.1 |
| #SULT1A3b | 10 | 2.2 | 1.6 | 5.7 | 0.4 | 14.2 | 8.2 | 2.3 | 11.2 | 2.8 | 4 | 1.0 | 0.0 | 1.1 | 1.0 | 1.1 |
| #SULT1B1 | 10 | 5.7 | 3.1 | 11.3 | 2.1 | 5.4 | 7.6 | 2.7 | 11.8 | 2.6 | 4.5 | 1.0 | 0.1 | 1.2 | 0.8 | 1.5 |
| #SULT1E1 | 10 | 113.2 | 89.0 | 269.1 | 12.1 | 22.2 | 1.2 | 0.4 | 1.7 | 0.6 | 2.8 | 1.1 | 0.1 | 1.2 | 1.0 | 1.2 |
| #SULT2A1 | 10 | 41.1 | 24.9 | 86.7 | 6.2 | 13.9 | 42.4 | 24.0 | 77.0 | 12.6 | 6.1 | 1.0 | 0.0 | 1.1 | 1.0 | 1.1 |
| Tumor Tissues | ||||||||||||||||
| SULT1A1 | 10 | 22.9 | 35.4 | 96.8 | 1.1 | 88 | 6.4 | 7.9 | 21.6 | 0.2 | 108 | 0.4 | 0.5 | 1.7 | 0.0 | 1.7 |
| SULT1A3a | 10 | 48.2 | 105.6 | 345.1 | 2.4 | 143.8 | 7.7 | 3.6 | 14.3 | 3.4 | 4.2 | 0.7 | 0.1 | 2.7 | 0.2 | 13.5 |
| SULT1A3b | 10 | 10.4 | 22.2 | 72.7 | 0.8 | 90.9 | 7.7 | 3.6 | 14.3 | 3.4 | 4.2 | 0.7 | 0.1 | 2.7 | 0.2 | 13.5 |
| SULT1B1 | 10 | 9.8 | 8.9 | 25.4 | 0.8 | 31.8 | 12.2 | 4.9 | 20.9 | 6.4 | 3.3 | 1.0 | 0.4 | 1.6 | 0.6 | 2.7 |
| SULT1E1 | 10 | 126.9 | 149.7 | 466.4 | 4.9 | 95.2 | 1.1 | 0.8 | 2.5 | 0.2 | 12.5 | 0.5 | 0.7 | 2.2 | 0.0 | 2.2 |
| SULT2A1 | 10 | 20.4 | 16.6 | 39.4 | 0.4 | 98.5 | 29.9 | 24.2 | 73.1 | 3.4 | 21.5 | 0.2 | 0.3 | 1.1 | 0.0 | 1.1 |
| Healthy Tissues | ||||||||||||||||
| SULT1A1 | 10 | 114.1 | 27.9 | 151.0 | 64.2 | 2.4 | 23.7 | 12.9 | 48.5 | 12.1 | 4.0 | — | — | — | — | — |
| SULT1A3a | 10 | 10.2 | 4.0 | 16.8 | 4.4 | 3.8 | 5.2 | 2.0 | 8.2 | 2.2 | 3.7 | — | — | — | — | — |
| SULT1A3b | 10 | 3.3 | 2.2 | 7.9 | 0.7 | 11.3 | 5.2 | 2.0 | 8.2 | 2.2 | 3.7 | — | — | — | — | — |
| SULT1B1 | 10 | 4.2 | 1.7 | 7.1 | 2.2 | 3.2 | 5.4 | 2.2 | 8.8 | 1.8 | 4.9 | — | — | — | — | — |
| SULT1E1 | 10 | 171.3 | 134.3 | 439.6 | 60.3 | 7.3 | 2.4 | 0.9 | 4.2 | 1.5 | 2.8 | — | — | — | — | — |
| SULT2A1 | 10 | 76.80 | 7.7 | 89.7 | 66.0 | 1.4 | 63.6 | 19.9 | 90.9 | 31.1 | 2.9 | — | — | — | — | — |
aThe metabolite is dopamine 3-O-Sulfate.
bThe metabolite is dopamine 4-O-Sulfate.
#One concentration of probe substrate activities for each SULT: 1 μM p-nitrophenol for SULT1A1; 0.625 μM dopamine for SULT1A3; 2.5 μM 2-aminophenol for SULT1B1; 10 μM 17β-estradiol for SULT1E1 and 1 μM DHEA for SULT2A1.
Figure 4.
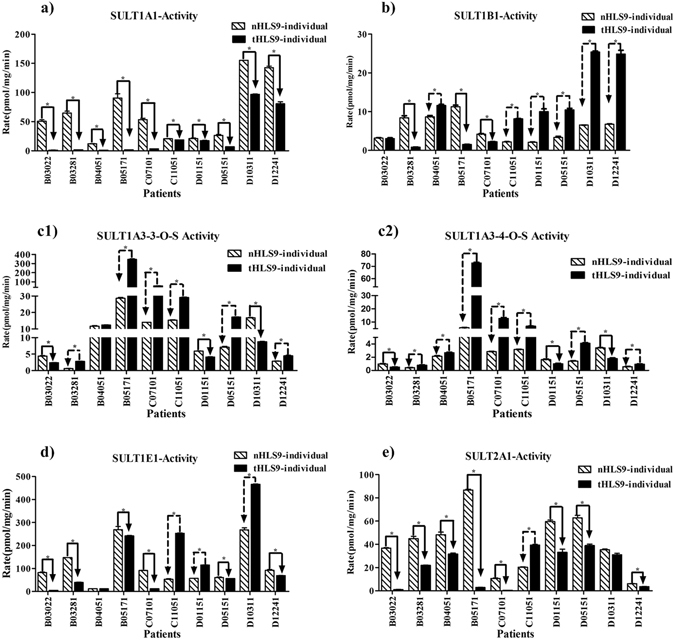
Activities of five SULT enzymes in human liver S9 prepared from HCC tumors (tHLS9-individual) and matched pericarcinomatous tissues (nHLS9-individual: (a–e). (c1) dopamine 3-O-sulfate, (c2) dopamine 4-O-sulfate. All the experiments were performed in triplicate, and the data are presented as mean ± SD. Paired sample t- test was performed for data analysis, and P < 0.05 was regarded as statistically significant.
Impaired SULT enzymatic protein amounts in tumor tissues of HCC patients
For SULT1A1 isoform (as quantified by LC-MS/MS), 70% of the samples had higher amounts in pericarcinomatous tissues than tumor tissues, and 30% had lower amounts in pericarcinomatous tissues than tumor tissues; for SULT1B1, 20% had higher amounts in pericarcinomatous tissues than tumor tissues, 70% had lower amounts in pericarcinomatous tissues than tumor tissues, and 10% were left unchanged; for SULT1A3, 50% had higher amounts in pericarcinomatous tissues than tumor tissues, 30% had lower amounts in pericarcinomatous tissues than tumor tissues, and 20% were left unchanged; for SULT1E1, 40% had higher amounts in pericarcinomatous tissues than tumor tissues, 40% had lower amounts in pericarcinomatous tissues than tumor tissues, and 20% were left unchanged; for SULT2A1, 70% had higher amounts in pericarcinomatous tissues than tumor tissues, 10% had lower amounts in pericarcinomatous tissues than tumor tissues, and 20% were left unchanged (Fig. 5).
Figure 5.
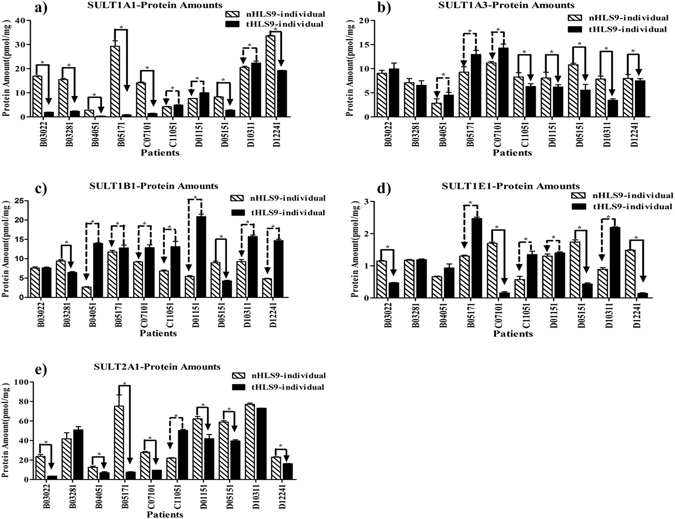
Protein amounts of the five SULT enzymes in human liver S9 prepared from HCC tumors (tHLS9-individual) and matched pericarcinomatous tissues (nHLS9-individual: (a–e). Absolute protein amounts were quantified through MRM LC-MS/MS method (n = 10). All the experiments were performed in triplicate, and data are presented as mean ± SD. Paired sample t-test was used for data analysis, and P < 0.05 was regarded as statistically significant.
Downregulated SULT enzymatic mRNA expression levels in tumor tissues of HCC patients
The mRNA expression levels of SULT enzymes were determined in tumors and matched pericarcinomatous tissues of 10 HCC patients using real-time PCR. As shown in Fig. 6, the SULT1A1, SULT1A3, SULT1B1, SULT1E1 and SULT2A1 were unequivocally expressed in all the samples of the HCC tumors and matched pericarcinomatous tissues. The mRNA expression levels of SULT1A1 (Fig. 6(a)), SULT1A3 (Fig. 6(b)), SULT1E1 (Fig. 6(d)), and SULT2A1 (Fig. 6(e)) decreased or drastically decreased in 90% of the tumor samples in comparison with the matched pericarcinomatous samples. SULT1B1 expression showed significantly small differences, with a few matched samples showing any significant difference in RNA expression (Fig. 6(c)).
Figure 6.
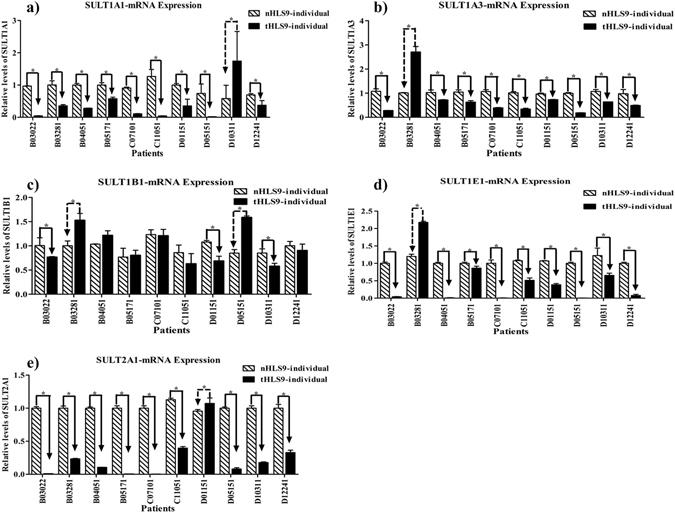
mRNA expressions of the five SULT enzymes in tumors and matched pericarcinomatous tissues of 10 human liver S9 samples with HCC (a–e). Relative expression differences were calculated through the comparative ΔΔCt method, and Ct values were normalized to GAPDH expression levels. All measurements were performed in triplicate and the relative expression levels of the target genes were presented as 2−ΔΔCt. Data are presented as mean ± SD. Paired-sample t-test was used for data analysis, and P < 0.05 was regard as statistically significant.
Correlation of protein amounts and mRNA expression levels with SULT enzymatic activities
To determine whether protein amounts are more effective than mRNA levels as indicators for predicting SULT activities in liver tissues, we correlated the protein amounts and mRNA expression levels with the activities of the SULT enzymes. As shown in Table 4, in tumor tissues, correlation coefficients greater than 0.593 were found between protein amounts and enzymatic activities in all the measured SULTs, particularly SULT1A1, which showed a high correlation coefficient of 0.950. In pericarcinomatous tissues, the correlation coefficient values of more than 0.6 were found in three SULTs (1A1, 1B1, and SULT1E1), and SULT1A1 showed a high correlation coefficient of 0.849. No correlation was found between protein amounts and activities of the SULT1A3 and SULT1B1 in pericarcinomatous tissues. For all the measured SULTs in the pericarcinomatous and tumor tissues, correlations were not found between protein amounts and mRNA expression levels (except for SULT1A1 and SULT1B1 in tumor tissues). In summary, in the pericarcinomatous and tumor tissues, the correlation between the SULT enzymatic activities and the protein amounts was better than that between the activities and the mRNA expression levels for a majority of the SULT enzymes.
Table 4.
Correlation of Enzyme Activity Protein to Protein Amounts and mRNA Expression Level of SULT Enzymes.
| Enzyme | Protein Amounts VS Activity | Protein Amounts VS mRNA | Activity VS mRNA | |||
|---|---|---|---|---|---|---|
| Nc | Td | Nc | Td | Nc | Td | |
| r2 | r2 | r2 | r2 | r2 | r2 | |
| SULT1A1 | 0.849e | 0.977e | 0.486 | 0.705e | 0.698e | 0.730e |
| SULT1A3a | 0.120 | 0.593 | 0.159 | 0.166 | 0.422 | 0.402 |
| SULT1A3b | 0.148 | 0.599 | 0.159 | 0.159 | 0.092 | 0.095 |
| SULT1B1 | 0.222 | 0.412 | 0.386 | 0.676e | 0.292 | 0.328 |
| SULT1E1 | 0.690e | 0.783e | 0.362 | 0.479 | 0.474 | 0.197 |
| SULT2A1 | 0.637e | 0.690e | 0.366 | 0.381 | 0.351 | 0.419 |
aThe metabolite is dopamine 3-O-Sulfate.
bThe metabolite is dopamine 4-O-Sulfate.
cN: Pericarcinomatous.
dT: Tumor.
eStatistical significance of association (P < 0.05).
r2Pearson correlation coefficient.
Non-impairment of catalytic capacity of SULT enzymes was in healthy, pericarcinomatous, and HCC tumor S9
As shown in Fig. 7 and Table 5, the TONs of SULTs other than SULT1A1 in the tumor tissues were nearly identical to the values observed in the pericarcinomatous tissues and healthy samples (P > 0.05), thereby suggesting that the catalytic efficiency of SULTs was not seriously impaired in tumor S9. For SULT1A1, the catalytic efficiency of SULT1A1 was significantly higher in the healthy human samples than in the pericarcinomatous and tumor tissues, but the maximal difference was considerably moderate at only 1.9-fold (healthy tissues vs. tumor tissues) or less (healthy tissues vs. pericarcinomatous tissues).
Figure 7.
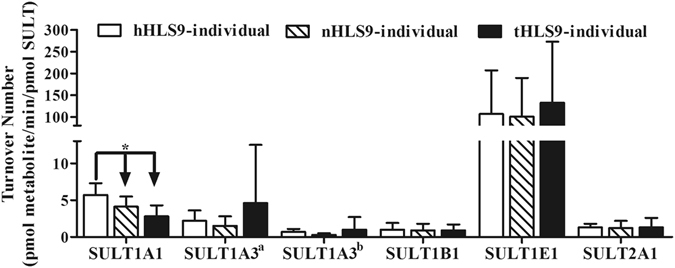
TONs of the probe substrates metabolized by SULT enzymes in healthy donors, HCC tumors, and match pericarcinomatous tissues, thereby, indicating the catalytic efficiency of enzymes. There is one concentration of probe substrate activities for each SULT, as follow: 1 μM p-nitrophenol for SULT1A1, 0.625 μM dopamine for SULT1A3, 2.5 μM 2-aminophenol for SULT1B1, 10 μM 17β-estradiol for SULT1E1, and 1 μM DHEA for SULT2A1. It is defined as the number of substrate molecules that can be converted by enzyme proteins into products per unit of time. Paired sample t-test or Wilcoxon’s sign rank test was used for data analysis. “*”Denotes statistical significance (P < 0.05).
Table 5.
Summary of turnover numbers of probe substrate metabolized by SULT enzymes.
| Isoforms | TON (hHLS9-individual)a | TON (nHLS9-individual)b | TON (tHLS9-individual)c | nd | ||||||
|---|---|---|---|---|---|---|---|---|---|---|
| Mean | SD | 95%CIe | Mean | SD | 95%CI | Mean | SD | 95%CI | ||
| pmol metabolite formed/min/pmol SULT enzymes | ||||||||||
| SULT1A1 | 5.4 | 1.5 | 4.4~6.5 | 4.1f | 1.4 | 3.1~5.1 | 2.8f | 1.5 | 1.8~4.0 | 10 |
| SULT1A3g1 | 2.2 | 1.4 | 1.2~3.3 | 1.5 | 1.3 | 0.5~2.4 | 4.6 | 7.9 | 1.1~10.2 | 10 |
| SULT1A3g2 | 0.7 | 0.4 | 0.4~0.9 | 0.3 | 0.2 | 0.1~0.5 | 1.0 | 1.7 | 0.2~2.2 | 10 |
| SULT1B1 | 1.0 | 0.9 | 0.4~1.6 | 0.9 | 0.9 | 0.3~1.6 | 0.9 | 0.8 | 0.3~1.4 | 10 |
| SULT1E1 | 106.6 | 100.3 | 34.9~178.4 | 100.9 | 88.9 | 37.3~164.5 | 132.4 | 140.31 | 32.0~232.8 | 10 |
| SULT2A1 | 1.3 | 0.5 | 0.97~1.7 | 1.2 | 1.0 | 0.4~1.9 | 1.3 | 1.3 | 0.4~2.2 | 10 |
a,b,cTurnover numbers of probe substrates metabolized by SULT enzymes in hHLS9-individual, nHLS9-individual and tHLS9-individual, which were calculated as the ration of maimal metabolic rate (Vmax) to the total amount of SULTs enzyme that is shown in Figs 4 and 6.
dNumbers of donors were calculating turnover numbers.
e95% CI represents the 95% confidence interval. Paired-samples t test or Wilcoxon sign rank test was used for data analysis.
fStatistical significance (P < 0.05).
g1,g2Dopamine was the probe substrate of the SULT1A3. Dopamine has two isomeride metabolites: dopamine 3-O-Sulfate and dopamine 4-O-Sulfate.
Discussion
The results of our study clearly showed that the rapid LC-MS/MS method was superior in speed for all SULT isoforms and in specificity for a majority of the SULT isoforms in determining the levels of SULT protein amounts and activities. This superiority is supported by the following: the LC-MS/MS method was more specific than Western blot in determining the protein amounts of SULTs, the protein amounts obtained from the LC-MS/MS method were representative of the probe substrate activities in the human liver S9 samples of pericarcinomatous and HCC patients, and the method was run in less than 10 min with a maximum sample preparation time of 6 h and may thus be readily used in human clinical situations. The latter may aid the development of a laboratory SULT quantification method useful for precision medicine with respect to drugs that mainly undergo sulfonation in both healthy and HCC populations. The actual implementation would probably require a prospective clinical study.
Our results also showed that the LC-MS/MS method for detecting SULT enzymes with respect to specificity, accuracy and speed is superior to the current methods for detecting the expression levels of SULT enzymes based on Western blot or RT-PCR. For SULT enzymes, the mRNA expression levels cannot reflect protein expression, and Western blot analysis involves long and complex experimental procedures that may be compromised because of the lack of highly specific antibodies33. By contrast, the precision and accuracy of the new method meet strict quantification standards, for the determination of CYP and UGT protein amounts in human liver microsomes in a previous study22 and in other research laboratories34, 35. The robust method is reproducible and reliable.
Large amounts of data demonstrated that protein (SULT) amounts as measured using LC-MS/MS were more representative of the probe substrate activities than the expression levels derived from q-PCR or some Western blot. The advantages of the LC-MS/MS method include its specificity, whereas antibodies are only specific 40% of the time. For SULT1A1, the activities and expression levels were the highest, and for some unknown reason, the lack of specificity did not seem to negatively affect the correlation as much. In our previous study, we also observed that for a few abundantly expressed CYP isoforms (e.g., CYP3A4), the correlation coefficients between various measurements were highly satisfactory22.
The LC-MS/MS method may be applied directly in clinical detection, because only small amounts of tissues are required for simultaneously quantifying the protein amounts of five major SULT enzymes in human liver S9. In fact, we and other researchers could assay both phase I and phase II enzymes in a single run, reaching 50 enzymes and transporters combined19, 22, 35. Thus, the MRM UHPLC-MS/MS method is capable of distinguishing multiple factors that govern drug disposition in a single run, thereby allowing the data generated to be utilized for modifying drug intervention strategies in clinical settings. For patients suffering from inoperable HCC, a liver biopsy followed by LC-MS/MS-based SULT enzyme quantification may be a good starting point for the development of personalized chemotherapy or chemoablation therapy. Ideally, selecting drugs on the basis of HCC SULT levels could identify drugs that are highly active in tumors but less toxic or nontoxic in normal liver cells.
When a superior analytical method is developed, it could potentially lead to an improved understanding of the physiology or pathophysiology of the organ system. In this case, our systemic studies showed that drug metabolism via SULTs is often altered, but the extent of the changes is highly individualized, with some tumor S9 exhibiting a significant decrease in protein amounts and probe substrate activities and with others exhibiting a significant increase relative to matched pericarcinomatous tissues. Theoretically, such a large change may be due to changes in expression levels or catalytic efficiency of each expressed enzyme (due to post-translational modification). Using TONs of SULTs as a measurement of catalytic efficiency, we found that with the exception of that for SULT1A1, TON did not change in the tumor vs. pericarcinomatous tissues, even with a large decrease in activities or expressions in 90% of the subjects. For SULT1A1, the change of its TON was relatively small (less than twofold). Hence, the data showed that the tumor cells usually expressed lower amounts of SULT proteins in comparison with pericarcinomatous tissues, but those SULT proteins appeared to be just as active, with the exception of SULT1A1, which appeared to be moderately less active. Further studies are needed to determine why SULT1A1 had a low TON in tumor tissues.
Lastly, SULTs are involved in the metabolism of carcinogens and drugs36, 37. A recent report further suggests SULT1A3 may be used as prognostic biomarkers of osteosarcoma38. Whether finding applies to liver cancer is unknown. What we did show is that in terms of activity levels, the probe substrate activities of SULT1A3 were significantly higher in most of the tumor samples and in pooled tumor S9 preparation. Hence, SULT1A3 overexpression may also be an indicator of liver cancer prognosis, although we did not find direct evidence linking them together. In addition, the probe substrates for SULTs do not always enjoy the same status as CYP probe substrates; that is, they might not be as carefully studied as fewer labs are studying SULT activities in comparison with those exploring CYPs. Hence, caution must be exercised when linking probe substrate activities with expressions of SULT isoform exclusivity.
Conclusion
This study is the first to demonstrate that the absolute quantification of SULT enzymes through MRM UHPLC-MS/MS can be achieved using human liver S9 samples. We believe that our method features several advantages, including higher specificity, better reproducibility, and better precision in comparison with Western blot and q-PCR. Moreover, the short run time means the method can rapidly analyze many SULT isoforms in one MRM assay in comparison with traditional methods. In this way, this can be used in the simultaneous quantification of multiple enzymes and efflux transporters from a single patient sample in a relatively short period of time.
Electronic supplementary material
LC-MS/MS quantification of sulfotransferases is better than conventional immunogenic methods in determining human liver SULT activities: implication in precision medicine
Acknowledgements
This work was supported by the grants of Key International Joint Research Project of National Natural Science Foundation of China (81120108025), Science and Technology Project of Guangzhou City (201509010004), and Guangdong Natural Science Foundation (2015AD030312012 and 2015B020233015). This work was supported by the grants of Key International Joint Research Project of National Natural Science Foundation of China (81120108025), Science and Technology Project of Guangzhou City (201509010004), and Guangdong Natural Science Foundation (2015AD030312012).
Author Contributions
Cong Xie performed the experiments, data analysis and drafted the article. Fuyuan Zhou provided HCC patients’ tissues. Zhongqiu Liu, Ming Hu and Tongmeng Yan participated in research design. Jiamei Chen, Xiaoyan Li, Juan Zou, Linlin Lu, Ying Wang and Lijun Zhu conducted the experiments. Zhongqiu Liu is acknowledged for financially funding the clinical study with HCC. All authors have read and approved the manuscript.
Competing Interests
The authors declare that they have no competing interests.
Footnotes
Cong Xie and Tong-meng Yan contributed equally to this work.
Electronic supplementary material
Supplementary information accompanies this paper at doi:10.1038/s41598-017-04202-w
Publisher's note: Springer Nature remains neutral with regard to jurisdictional claims in published maps and institutional affiliations.
Contributor Information
Fu-yuan Zhou, Email: fuyuan@fimmu.com.
Zhong-qiu Liu, Email: liuzq@gzucm.edu.cn.
Ming Hu, Email: mhu@uh.edu.
References
- 1.Ginsburg GS, Willard HF. Genomic and personalized medicine: foundations and applications. Translational research: the journal of laboratory and clinical medicine. 2009;154:277–287. doi: 10.1016/j.trsl.2009.09.005. [DOI] [PubMed] [Google Scholar]
- 2.Wang, Z., Liu, X., Ho, R. L., Lam, C. W. & Chow, M. S. Precision or Personalized Medicine for Cancer Chemotherapy: Is there a Role for Herbal Medicine. Molecules21, doi:10.3390/molecules21070889 (2016). [DOI] [PMC free article] [PubMed]
- 3.Quetglas IM, Moeini A, Pinyol R, Llovet JM. Integration of genomic information in the clinical management of HCC. Best Pract Res Clin Gastroenterol. 2014;28:831–842. doi: 10.1016/j.bpg.2014.08.004. [DOI] [PubMed] [Google Scholar]
- 4.Ahmed, S., Zhou, Z., Zhou, J. & Chen, S. Q. Pharmacogenomics of Drug Metabolizing Enzymes and Transporters: Relevance to Precision Medicine. Genomics, proteomics & bioinformatics, doi:10.1016/j.gpb.2016.03.008 (2016). [DOI] [PMC free article] [PubMed]
- 5.Zaslavsky O, Zisberg A, Shadmi E. Impact of functional change before and during hospitalization on functional recovery 1 month following hospitalization. J Gerontol A Biol Sci Med Sci. 2015;70:381–386. doi: 10.1093/gerona/glu168. [DOI] [PubMed] [Google Scholar]
- 6.Manczak, M., Kandimalla, R., Fry, D., Sesaki, H. & Reddy, P. H. Protective Effects of Reduced Dynamin-related Protein 1 Against Amyloid Beta-induced Mitochondrial Dysfunction and Synaptic Damage in Alzheimer’s Disease. Hum Mol Genet, doi:10.1093/hmg/ddw330 (2016). [DOI] [PMC free article] [PubMed]
- 7.Xu XF, Dai HP, Li YM, Xiao F, Wang C. Mass Spectrometry-based Proteomics in Acute Respiratory Distress Syndrome: A Powerful Modality for Pulmonary Precision Medicine. Chin Med J (Engl) 2016;129:2357–2364. doi: 10.4103/0366-6999.190669. [DOI] [PMC free article] [PubMed] [Google Scholar]
- 8.Riches Z, Stanley EL, Bloomer JC, Coughtrie MW. Quantitative evaluation of the expression and activity of five major sulfotransferases (SULTs) in human tissues: the SULT “pie”. Drug metabolism and disposition: the biological fate of chemicals. 2009;37:2255–2261. doi: 10.1124/dmd.109.028399. [DOI] [PMC free article] [PubMed] [Google Scholar]
- 9.Dong D, Ako R, Wu B. Crystal structures of human sulfotransferases: insights into the mechanisms of action and substrate selectivity. Expert opinion on drug metabolism & toxicology. 2012;8:635–646. doi: 10.1517/17425255.2012.677027. [DOI] [PubMed] [Google Scholar]
- 10.Hui Y, et al. Sulfation of afimoxifene, endoxifen, raloxifene, and fulvestrant by the human cytosolic sulfotransferases (SULTs): A systematic analysis. Journal of pharmacological sciences. 2015;128:144–149. doi: 10.1016/j.jphs.2015.06.004. [DOI] [PubMed] [Google Scholar]
- 11.Zhou X, Wang S, Sun H, Wu B. Sulfonation of raloxifene in HEK293 cells overexpressing SULT1A3: Involvement of breast cancer resistance protein (BCRP/ABCG2) and multidrug resistance-associated protein 4 (MRP4/ABCC4) in excretion of sulfate metabolites. Drug metabolism and pharmacokinetics. 2015;30:425–433. doi: 10.1016/j.dmpk.2015.09.001. [DOI] [PubMed] [Google Scholar]
- 12.Khamphio M, Barusrux S, Weerapreeyakul N. Sesamol induces mitochondrial apoptosis pathway in HCT116 human colon cancer cells via pro-oxidant effect. Life sciences. 2016;158:46–56. doi: 10.1016/j.lfs.2016.06.017. [DOI] [PubMed] [Google Scholar]
- 13.Riches Z, Bloomer JC, Coughtrie MW. Comparison of 2-aminophenol and 4-nitrophenol as in vitro probe substrates for the major human hepatic sulfotransferase, SULT1A1, demonstrates improved selectivity with 2-aminophenol. Biochemical pharmacology. 2007;74:352–358. doi: 10.1016/j.bcp.2007.04.006. [DOI] [PubMed] [Google Scholar]
- 14.Huang LR, Coughtrie MW, Hsu HC. Down-regulation of dehydroepiandrosterone sulfotransferase gene in human hepatocellular carcinoma. Molecular and cellular endocrinology. 2005;231:87–94. doi: 10.1016/j.mce.2004.10.002. [DOI] [PubMed] [Google Scholar]
- 15.Nagar S, Walther S, Blanchard RL. Sulfotransferase (SULT) 1A1 polymorphic variants *1, *2, and *3 are associated with altered enzymatic activity, cellular phenotype, and protein degradation. Molecular pharmacology. 2006;69:2084–2092. doi: 10.1124/mol.105.019240. [DOI] [PubMed] [Google Scholar]
- 16.Li J, Bluth MH. Pharmacogenomics of drug metabolizing enzymes and transporters: implications for cancer therapy. Pharmacogenomics and personalized medicine. 2011;4:11–33. doi: 10.2147/PGPM.S18861. [DOI] [PMC free article] [PubMed] [Google Scholar]
- 17.Zhang G, et al. Regulation of drug-metabolizing enzymes and efflux transporters by Astragali radix decoction and its main bioactive compounds: Implication for clinical drug-drug interactions. J Ethnopharmacol. 2016;180:104–113. doi: 10.1016/j.jep.2016.01.031. [DOI] [PubMed] [Google Scholar]
- 18.Schaefer O, et al. Absolute quantification and differential expression of drug transporters, cytochrome P450 enzymes, and UDP-glucuronosyltransferases in cultured primary human hepatocytes. Drug metabolism and disposition: the biological fate of chemicals. 2012;40:93–103. doi: 10.1124/dmd.111.042275. [DOI] [PubMed] [Google Scholar]
- 19.Kawakami H, et al. Simultaneous absolute quantification of 11 cytochrome P450 isoforms in human liver microsomes by liquid chromatography tandem mass spectrometry with in silico target peptide selection. Journal of pharmaceutical sciences. 2011;100:341–352. doi: 10.1002/jps.22255. [DOI] [PubMed] [Google Scholar]
- 20.Fallon JK, Neubert H, Hyland R, Goosen TC, Smith PC. Targeted quantitative proteomics for the analysis of 14 UGT1As and -2Bs in human liver using NanoUPLC-MS/MS with selected reaction monitoring. J Proteome Res. 2013;12:4402–4413. doi: 10.1021/pr4004213. [DOI] [PubMed] [Google Scholar]
- 21.Xu B, Gao S, Wu B, Yin T, Hu M. Absolute quantification of UGT1A1 in various tissues and cell lines using isotope label-free UPLC-MS/MS method determines its turnover number and correlates with its glucuronidation activities. J Pharm Biomed Anal. 2014;88:180–190. doi: 10.1016/j.jpba.2013.08.024. [DOI] [PMC free article] [PubMed] [Google Scholar]
- 22.Yan T, et al. Significantly decreased and more variable expression of major CYPs and UGTs in liver microsomes prepared from HBV-positive human hepatocellular carcinoma and matched pericarcinomatous tissues determined using an isotope label-free UPLC-MS/MS method. Pharmaceutical research. 2015;32:1141–1157. doi: 10.1007/s11095-014-1525-x. [DOI] [PMC free article] [PubMed] [Google Scholar]
- 23.Yarbro JW, Page DL, Fielding LP, Partridge EE, Murphy GP. American Joint Committee on Cancer prognostic factors consensus conference. Cancer. 1999;86:2436–2446. doi: 10.1002/(SICI)1097-0142(19991201)86:11<2436::AID-CNCR35>3.0.CO;2-#. [DOI] [PubMed] [Google Scholar]
- 24.Dias C, Testa B, Soveral G, Dias M, Constantino L. Screening of the inhibitory effect of xenobiotics on alcohol metabolism using S9 rat liver fractions. Toxicol In Vitro. 2012;26:1177–1180. doi: 10.1016/j.tiv.2012.06.011. [DOI] [PubMed] [Google Scholar]
- 25.Sjodin MO, Wetterhall M, Kultima K, Artemenko K. Comparative study of label and label-free techniques using shotgun proteomics for relative protein quantification. J Chromatogr B Analyt Technol Biomed Life Sci. 2013;928:83–92. doi: 10.1016/j.jchromb.2013.03.027. [DOI] [PubMed] [Google Scholar]
- 26.Franca A, Melo LD, Cerca N. Comparison of RNA extraction methods from biofilm samples of Staphylococcus epidermidis. BMC Res Notes. 2011;4:572. doi: 10.1186/1756-0500-4-572. [DOI] [PMC free article] [PubMed] [Google Scholar]
- 27.Bi X, Zhao Y, Fang W, Yang W. Anticancer activity of Panax notoginseng extract 20(S)-25-OCH3-PPD: Targetting beta-catenin signalling. Clin Exp Pharmacol Physiol. 2009;36:1074–1078. doi: 10.1111/j.1440-1681.2009.05203.x. [DOI] [PubMed] [Google Scholar]
- 28.Wang, C., Robles, F., Ramirez, S., Riber, A. B. & Bojesen, A. M. Culture-independent identification and quantification of Gallibacterium anatis (G. anatis) by real-time quantitative PCR. Avian Pathol, 1–17, doi:10.1080/03079457.2016.1184743 (2016). [DOI] [PubMed]
- 29.Livak KJ, Schmittgen TD. Analysis of relative gene expression data using real-time quantitative PCR and the 2(-Delta Delta C(T)) Method. Methods. 2001;25:402–408. doi: 10.1006/meth.2001.1262. [DOI] [PubMed] [Google Scholar]
- 30.Houston JB, Kenworthy KE. In vitro-in vivo scaling of CYP kinetic data not consistent with the classical Michaelis-Menten model. Drug metabolism and disposition: the biological fate of chemicals. 2000;28:246–254. [PubMed] [Google Scholar]
- 31.Aebersold R, Burlingame AL, Bradshaw RA. Western blots versus selected reaction monitoring assays: time to turn the tables? Mol Cell Proteomics. 2013;12:2381–2382. doi: 10.1074/mcp.E113.031658. [DOI] [PMC free article] [PubMed] [Google Scholar]
- 32.Prasad B, Unadkat JD. Optimized approaches for quantification of drug transporters in tissues and cells by MRM proteomics. Aaps j. 2014;16:634–648. doi: 10.1208/s12248-014-9602-y. [DOI] [PMC free article] [PubMed] [Google Scholar]
- 33.Richard K, et al. Sulfation of thyroid hormone and dopamine during human development: ontogeny of phenol sulfotransferases and arylsulfatase in liver, lung, and brain. The Journal of clinical endocrinology and metabolism. 2001;86:2734–2742. doi: 10.1210/jcem.86.6.7569. [DOI] [PubMed] [Google Scholar]
- 34.Kaivosaari S, Finel M, Koskinen M. N-glucuronidation of drugs and other xenobiotics by human and animal UDP-glucuronosyltransferases. Xenobiotica; the fate of foreign compounds in biological systems. 2011;41:652–669. doi: 10.3109/00498254.2011.563327. [DOI] [PubMed] [Google Scholar]
- 35.Ohtsuki S, et al. Simultaneous absolute protein quantification of transporters, cytochromes P450, and UDP-glucuronosyltransferases as a novel approach for the characterization of individual human liver: comparison with mRNA levels and activities. Drug metabolism and disposition: the biological fate of chemicals. 2012;40:83–92. doi: 10.1124/dmd.111.042259. [DOI] [PubMed] [Google Scholar]
- 36.Kurogi K, et al. Sulfation of buprenorphine, pentazocine, and naloxone by human cytosolic sulfotransferases. Drug metabolism letters. 2012;6:109–115. doi: 10.2174/1872312811206020109. [DOI] [PubMed] [Google Scholar]
- 37.Miksits M, et al. Sulfation of resveratrol in human liver: evidence of a major role for the sulfotransferases SULT1A1 and SULT1E1. Xenobiotica; the fate of foreign compounds in biological systems. 2005;35:1101–1119. doi: 10.1080/00498250500354253. [DOI] [PubMed] [Google Scholar]
- 38.Chen X, et al. Proteomic profiling of osteosarcoma cells identifies ALDOA and SULT1A3 as negative survival markers of human osteosarcoma. Molecular carcinogenesis. 2014;53:138–144. doi: 10.1002/mc.21957. [DOI] [PubMed] [Google Scholar]
Associated Data
This section collects any data citations, data availability statements, or supplementary materials included in this article.
Supplementary Materials
LC-MS/MS quantification of sulfotransferases is better than conventional immunogenic methods in determining human liver SULT activities: implication in precision medicine