
Figure 2.
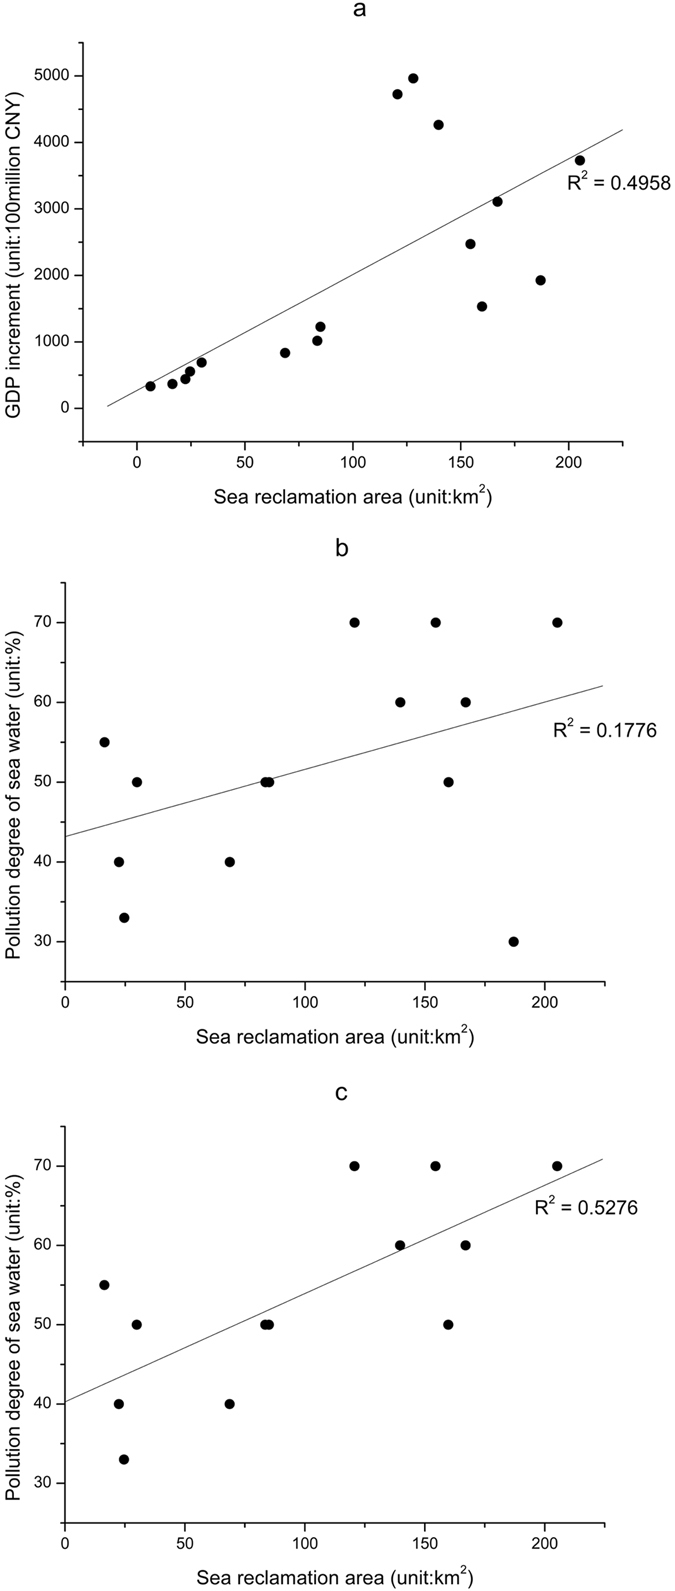
Scatter diagrams. (a) Coastal reclamation area and GDP growth, (b) Coastal reclamation area and pollution degree of sea water, and (c) Coastal reclamation area and pollution degree of sea water except for 2009.
Official websites use .gov
A
.gov website belongs to an official
government organization in the United States.
Secure .gov websites use HTTPS
A lock (
) or https:// means you've safely
connected to the .gov website. Share sensitive
information only on official, secure websites.
Scatter diagrams. (a) Coastal reclamation area and GDP growth, (b) Coastal reclamation area and pollution degree of sea water, and (c) Coastal reclamation area and pollution degree of sea water except for 2009.