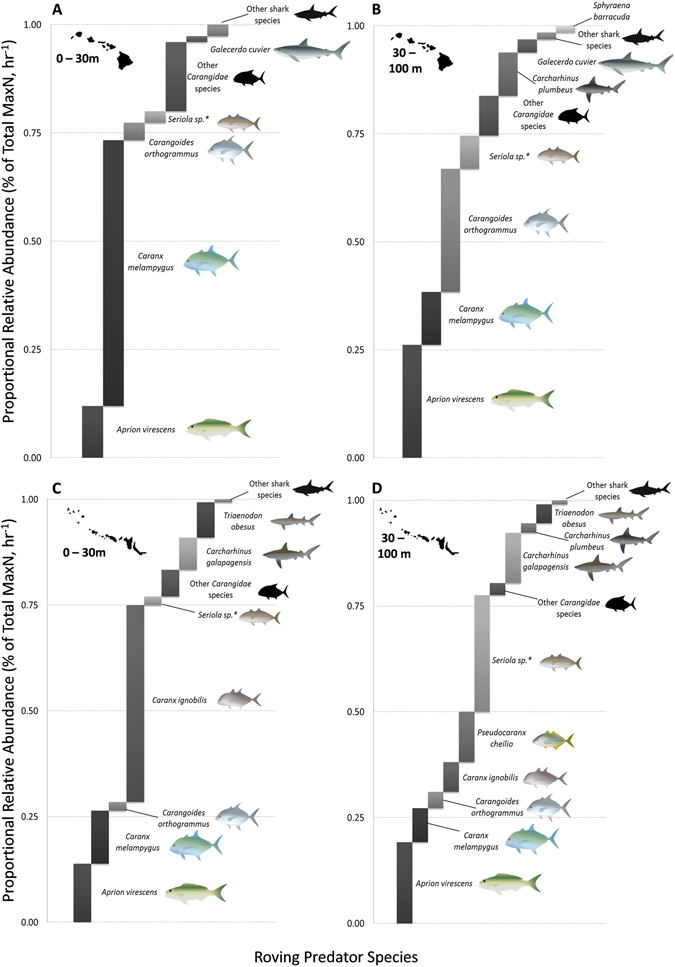
Figure 2.

(A) Shallow and (B) Mesophotic pproportional relative abundance (% of total MaxN, hr−1) of predator assemblages in the MHI. (C) Shallow and (B) Mesophotic pproportional relative abundance of predator assemblages in the NWHI. Staggered bar plots generated in MS Excel 2010 (https://products.office.com/en-us/microsoft-excel-2010). Maps in the figure were generated using Adobe Illustrator CS5 (https://www.adobe.com/products/illustrator.html).
