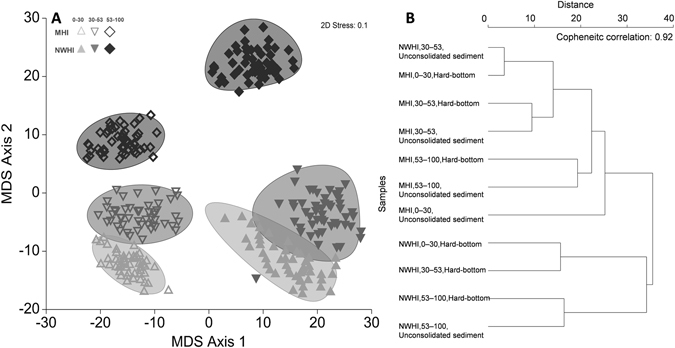
Figure 3.

(A) Bootstrap resampling plot, 50 bootstraps per group. Square root transformed, zero-adjusted Bray Curtis roving predator abundance data (MaxN, hr−1) by Region (MHI, NWHI) x Depth Strata (SPC; upper and lower mesophotic), plotted metric multi-dimensional scaling (mMDS). Shaded bootstrap regions, which represent measurements of centroid error: 95% confidence ellipses, averages based on m = 10 dimensional metric MDS (rho = 0.985). Open symbols represent MHI sites, closed symbols represent NWHI sites. Light grey = shallow water (0–30 m), medium grey = upper mesophotic (30–53 m), dark grey = lower mesophotic (53–100 m). (B) Hierarchical cluster analysis dendrogram of group centroids f by Region (MHI, NWHI), Depth (0–30 m, 30–53 m, 53–100 m), and Habitat (Hard-bottom, unconsolidated sediment). Note the absence of NWHI unconsolidated sampling sites between 0–30 m. Cophenetic correlation = 0.92.
