
Figure 4.
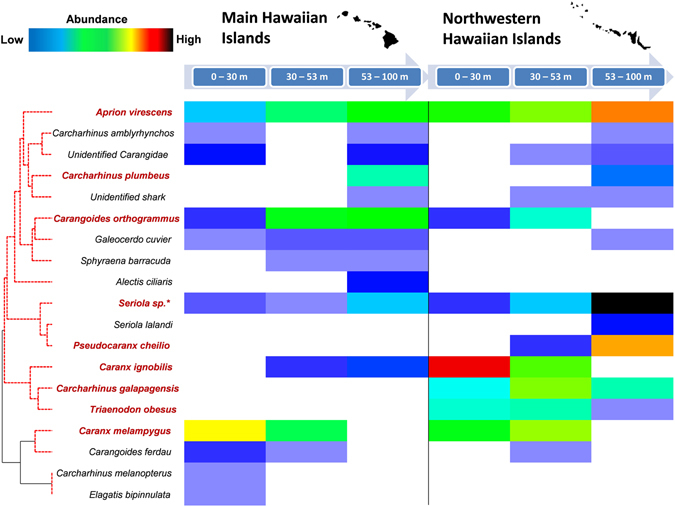
Shade plot showing regional (MHI, NWHI) and depth distributions of all roving predator species. Raw species relative abundance values (MaxN, hr−1: color ramped blocks) were square root transformed to down-weight more abundant species. Y-axis (roving predator resemblance): position of standardized MaxN, hr−1 predator values, ranked by Whittaker’s Index of Association transformation and Group Average Hierarchical Cluster analysis (Type III SIMPROF, with permutation between sites). Red dotted lines: groups of coherent species. Species identified in SIMPER highlighted in red. (b) X-axis: Sites grouped according to region (MHI, NWHI) and depth strata, aligned from left to right. Shade plot generated in PRIMER 7.0.11 (http://www.primer-e.com/). Maps in the figure were generated using Adobe Illustrator CS5 (https://www.adobe.com/products/illustrator.html).